Markets had a bit of a trip this week. US president Donald Trump has been given the benefit of the doubt so far. Investors are less convinced that he’ll be able to cut taxes the way he wanted to, but they’re still hopeful.
But with “this Russia stuff” really blowing up now, surely they might start to get a bit edgy?
Well, it seems that it takes more than the threat of potential impeachment to rattle this market. After a day of selling off, the US pretty much returned to the “buy the dip” mentality.
So is everything just fine? Nothing to see here – and even if there was, it wouldn’t matter?
Normally I’m happy to shrug off politics as an investor. But, I have to admit, I’m less keen on the idea this time. We’re well past the “Trump reflation” trade. The failure over healthcare put that one into firm perspective. Investors are now just flailing around and trying to find other reasons to stay bullish. If they don’t find something to latch on to soon, then the market might struggle.
Earlier this week, David Rosenberg of Gluskin Sheff mused on the market’s resilience, reminding us that it can take markets quite a long time to get to grips with the idea that things have changed.
“The stockmarket pulled a double peak in September 2000, long after it was apparent that the tech bubble was unravelling, and pulled a double peak yet again in October 2007 even as the evidence had been mounting for months that the housing and credit cycles were both unwinding.”
For me, this is a good example of market inefficiency at work. On the ground, the reality has changed. Trump was viewed as a man who “gets things done” and slashes taxes – he was going to be the second coming of Reagan. As it turns out, he can’t get anything done because he is very far out of his depth – incompetent, it seems. And if he goes on like this, he’ll be out on his ear. And even if he isn’t, you can forget the tax cuts and the stimulus packages for now.
If the market was to honestly reflect that, then a lot of the gains seen since November would have to evaporate. But markets don’t work like that. They are not objective measurements of “reality”. They are two-way things.
You see, investors have grown used to being bullish. They like it. The Trump reflation story might be dead in the water, so now they want to find another justification for being bullish.
Some argue that if Trump were to be replaced with Mike Pence, then tax cuts would be back on the menu. That’s fair enough, but what happens between now and then? Getting rid of a president is a time-consuming process. Can markets really hope to keep the dream alive over that period of time? I doubt it.
What about buoyant corporate US profits? Albert Edwards of Société Générale – bearish as ever – spoils the party by pointing out that: “Time and time again, at this late stage of the economic cycle, US pro forma stockmarket earnings totally detach themselves from the weakening macro profits data.
“We only discover much later that the economic whole economy profits data were correct and the stockmarket profits (eps) data were being heavily manipulated (legally, usually) by imaginative accountants to look as if all remains well.
“The awful truth is only revealed in the subsequent recession when years of fantasy stock market profits get erased as ‘below the line’ write-offs.”
This is starting to feel like a market on borrowed time. So just be careful out there.
The six charts that matter
On to a quick rundown of our “charts that matter”.
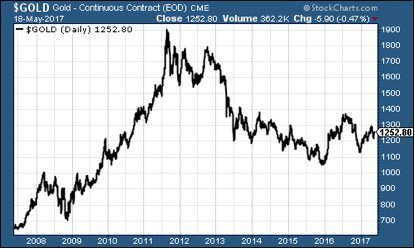
Gold
Gold had a big comeback this week, as Trump’s travails reminded investors that there are at least a few risks out there and also saw them sell off the dollar amid concerns (or hopes) that the latest scandal would help to put the Federal Reserve off raising interest rates in the US next month. Gold ended last week at around $1,224 per ounce, and rebounded sharply this week.
Copper
Copper has recovered a little this week, partly as a result of the weak dollar, rising from $2.51 at the end of last week. My gut feeling is that the commodity rally looks shaky in the absence of any further stimulus from the US (in the form of infrastructure spending) or China (same again really), but that’s a gut feeling rather than a firm conviction, so I’ll be watching the data closely.
US dollar
The US dollar has fallen sharply this week. It ended last week at around 99.5 but strength in the euro and fears over impeachment and political paralysis in the US have helped to send the currency lower.
US Treasury bonds
Meanwhile, yields on 10-year US Treasury bonds showed that at least some investors are still quick to dive into ‘safe havens’ at the first sign of any trouble. Last week, yields stood at around 2.39% – now they’ve dropped back as bond prices jumped. We’re a long way from the reflationary ‘point of no return’ of 2.6% – 3% (depending on which ‘bond king’ you prefer to listen to – Gundlach or Gross).
Bitcoin
Source: bitcoincharts.com
What can I say? Another stunner of a week. My colleague Charlie Morris put a $1,700 target on bitcoin a month or so ago when it was trading at closer to $1,000. It’s obliterated that now, as the chart above shows.
In general, the cryptocurrency area is going crazy. My feeling is that this is rather bubbly, and certainly the hype around ‘ICOs’ – whereby companies are effectively issuing what amount to exchange-tradeable gift cards (as far as I can see) to raise funds for start-ups that may or may not amount to anything – seems a very close analogue of the tech bubble.
At the end of the day, none of this is systemically important (certainly not as yet), so the only risks are to those who are playing the market. I’ll be watching with great curiosity but any money you put into this sort of stuff has to be seen as speculation along the lines of micro-caps, spread betting and all the other fun stuff that almost everyone ends up losing money on.
US jobless claims
Finally, the US jobless claims data. David Rosenberg of Gluskin Sheff sees this is a valuable leading indicator. When the figure hits a “cyclical trough” (as measured by the four-week moving average), a stock market peak is not far behind, and a recession follows about a year later.
As the short-term chart below shows, up until recently, it looked as though jobless claims had troughed at just under 240,000 at the end of February. So we’d be looking at the market (the S&P 500) peaking around the end of May.
Yet, the latest weekly data showed that claims fell to 232,000. Following a 236,000 reading last week, it looks as though the four-week moving average is heading for a fresh trough in the next few weeks.
Recession delayed? It wouldn’t surprise me. Then again, if Trump keeps going the way he’s going, it wouldn’t surprise me to see the market peak at the end of May either.