Before we get to the charts that matter this week, I just wanted to draw your attention to another chart that caught my eye this morning.
David Rosenberg at Gluskin Sheff is a consistently interesting (and very prolific) financial analyst. In a research note this week, he highlighted what he reckons “may be one of the most bullish, and under appreciated, charts on the planet right now.”
What’s he talking about? The booming number of women in work in Japan.
Since Japanese prime minister Shinzo Abe came to power in 2012, the percentage of women working has risen solidly, from a low of around 48.5% to around 50.5%. Meanwhile, the participation rate of 25-54 year old women has risen sharply from around 72% to more than 76%.
That’s good news for household incomes, which in turn is good news for consumption, which in turn is good news for share prices. It’s also one decent short-to-medium term solution for the country’s demographic problem of too many ageing workers.
Part of Abe’s election campaign is to promise more money to help women with cut-price childcare. If he does win later this month – which at the moment seems pretty likely – this demographic dividend might help.
Another interesting chart was in the Halkin newsletter this week, where Peter Warburton looks at Japanese wage growth. Although wage growth has been a very long time coming – and has been a perpetual “conundrum”, what with Japan’s apparently record low unemployment rate – wages do seem to be ticking higher slowly but surely.
It’s all good news for Japan, and may help to explain why despite a steady strengthening in the yen recently, the stockmarket has also been on a bit of a tear.
We’ve been fans of Japan for a long time, and we see no reason to alter that.
Now onto the charts of the week…
What the charts that matter can tell us this week
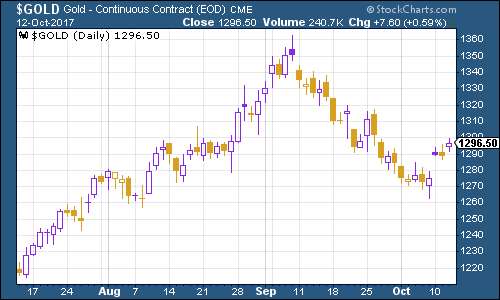
The US dollar has give up some of its recent rally, and that’s had a big impact on the price of many other assets across the globe. Firstly, gold has rallied strongly over the past week. There is a political risk element to all of this – US president Donald Trump is looking as unhinged as ever.
But as always, it’s monetary policy that’s the main driver. There are signs that US inflation is perking up. Both wages and producer prices are rising faster than expected. Meanwhile, the minutes from the latest US Federal Reserve meeting were viewed as broadly “dovish” – in other words, the Fed is in no hurry to pick up the pace.
If that’s the case, then “real” interest rates – the gap between inflation and interest rates – are likely to fall as inflation rises faster than rates do. That’s good news for gold.
(Gold: three months)
As I mentioned at the start, the US dollar index – a measure of the strength of the dollar against a basket of the currencies of its major trading partners – has slipped back this week as a result of the Fed’s relaxed tone.
(DXY: three months)
Meanwhile, the yield on ten-year US Treasury bonds has stayed roughly static.
(Ten-year US Treasury: three months)
The weaker dollar helped the strong rally in copper to continue. More on that below in the section about bitcoin.
(Copper: three months)
Bitcoin has had a spectacular week. This was the same week that football manager Harry Redknapp endorsed a new cryptocurrency on Twitter. I somehow doubt that those two things are connected. But in the wild world of digital currencies, who can say for sure?
I’m not a bitcoin sceptic by the way – I have no intention of buying it and I think the whole sector is in a quite incredible mania, but I do think bitcoin as a concept and as a technology has legs. My colleague Charlie Morris does a good job of explaining why here.
Actually, to be a little more serious, there’s an interesting correlation between copper prices and bitcoin prices. Bloomberg noted this recently – they tend to move in tandem to a really quite extraordinary extent. And what’s the link between them? China. Both bitcoin and copper are common targets for Chinese speculation (and Chinese capital flows). It’ll be interesting to see what comes out of the next five-year planning session of the Chinese Communist Party, coming up later this month.
(Bitcoin: six months)
This week, weekly US jobless claims continue to be disrupted by hurricane activity but this is starting to ease off now. The four-week average slipped back to 257,500 as claims came in at 243,000, lower than the 251,000 expected.
According to David Rosenberg of Gluskin Sheff, when US jobless claims hit a “cyclical trough” (as measured by the four-week moving average), a stockmarket peak is not far behind (on average 14 weeks), a recession follows about a year later.
So far, 20 May has been the cyclical trough, but the stockmarket keeps setting new peaks, and we still can’t get a clear reading on the jobless claims because of the hurricane disruption. It wouldn’t surprise me if there’s still a fresh low to come between now and Christmas.
(Four-week moving average, US jobless claims, since 2015)
The oil price (as measured by Brent crude, the international/European benchmark) has had a fairly uneventful week. There’s a sense that the market is capped at around the $60 a barrel mark by the extra influx of shale oil that is likely to result from a much higher price. We’ll see how true that is in the longer run.
(Brent crude oil: three months)
Finally there’s Amazon. The online retail and publishing giant had a good week as wider markets kept rising, poking its head back above the $1,000 a share mark. Amazon is lucky in some ways, in that it’s not exposed to quite the same levels of political risk that Google/Alphabet and Facebook in particular are facing.
(Amazon: three months)
However, I’d still be wary of moves to tighten up on the sector. There is a clear desire on the behalf of global governments to rein in the power of the tech giants, and at the end of the day, that’ll include Amazon.