Welcome to your weekend edition, where we take a look through the charts that matter and catch up on anything else that we missed during the week.
If you missed any of this week’s Money Mornings, here are the links you need.
Tuesday: An Italian euro exit may just have moved a little bit closer
Wednesday: Three long-term reasons to be bullish on gold
Thursday: A dip in the oil price could be very bullish for stockmarkets
Friday: Italy gets a new government – the eurozone hokey-cokey is on hold for now
The podcast will be back next week. Now over to this week’s charts.
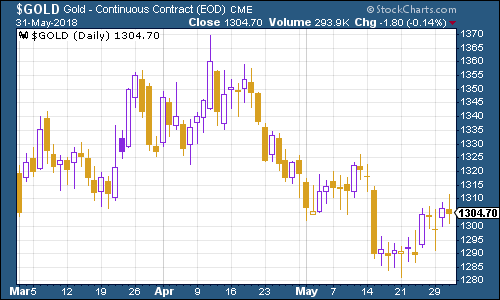
Gold is still meandering around the $1,300 an ounce mark. My colleague Dominic covered the long-term outlook in more detail Three long-term reasons to be bullish on gold.
(Gold: three months)
The US dollar index – a measure of the strength of the dollar against a basket of the currencies of its major trading partners – spiked higher mid-week as the euro slid on Italy woes, but then ended the week pretty much where it started as fears over Italy subsided somewhat.
(DXY: three months)
The yield on the ten-year US Treasury bond slipped sharply this week. Again, that was due mainly to safe haven demand on concerns about Italy.
(Ten-year US Treasury: three months)
Similarly, the yield on the ten-year German bund – the borrowing cost of Germany’s government, which is Europe’s “risk-free” rate – fell very sharply too, before rebounding a little.
(Ten-year bund yield: three months)
Copper continues to trade in a tight range.
(Copper: three months)
Bitcoin headed lower, then rebounded off the $7,000 a coin mark.
(Bitcoin: ten days)
On US employment, the four-week moving average of weekly US jobless claims rose a little to 222,250 this week, while weekly claims came in at 221,000, down from 234,000 last week.
According to David Rosenberg of Gluskin Sheff, when US jobless claims hit a “cyclical trough” (as measured by the four-week moving average), a stockmarket peak is not far behind (on average 14 weeks), and a recession follows about a year later.
We hit a new trough a fortnight ago, so if there’s anything to Rosenberg’s observations (and of course, they are drawn from a limited pool of past cycles), then we should see the stockmarket hit new highs before this cycle is out.
That would mean the S&P 500 returning to close to 2,900. Given that the Fed is starting to look a little more relaxed about inflation – and depending on what happens to oil, that’s definitely A dip in the oil price could be very bullish for stockmarkets
(US jobless claims, four-week moving average: since January 2016)
The oil price (as measured by Brent crude, the international/European benchmark) appears to have bashed its head on the $80 a barrel mark for now, and it’ll be interesting to see whether Saudi Arabia and Russia do decide to increase production or not over the next few weeks.
(Brent crude oil: three months)
Internet giant Amazon remains as popular as ever.
(Amazon: three months)
Electric car group Tesla meanwhile, continued to drift. Here’s an interesting story on that front: Japanese tech investment fund SoftBank has justed pumped $2.25bn into the driverless car unit of General Motors.
Now, this could be a wild, “out-there” notion, but as Charley Grant points out in the Wall Street Journal, maybe – just maybe – Tesla isn’t the future of the car industry.
Think about it – GM is a company that generates cash rather than burning it; that actually builds and sells an awful lot of cars rather than just talking about it; and that’s mostly focused on building vehicles, rather than sending them to Mars or putting them in massive underground tunnels.
Might a company like that represent a significant competitor to Tesla? Might it even be a better investment?
I know – crazy talk. Just putting it out there like the wacky contrarian I am.
(Tesla: three months)
Have a great weekend.