Welcome back. Don’t forget to sign up for more information on the MoneyWeek Wealth Summit on 22 November. Make sure you hear about the tickets first when they go on sale – sign up for our free updates, right here.
No new podcast this week, but if you missed Merryn and I talking about Neil Woodford’s plunge from grace, catch up here – and do leave a comment beneath.
Meanwhile, Dominic and I recorded a webinar with currency specialist Alex Edwards of OFX this week. It was an hour of free-ranging discussion on global trade, foreign exchange markets, interest rates, and how British businesses can protect themselves from the impact of unexpected political shocks on currency costs. Catch up with it here.
If you missed any of this week’s Money Mornings, here are the links you need:
Monday: Good news for markets – the US employment data was terrible
Tuesday: After the Woodford fallout, is it time to buy Hargreaves Lansdown and Patient Capital?
Wednesday: Commodities are dirt cheap – but is it time to buy?
Thursday: Why I favour Japan over the UK market
Friday: What does the tension in the Gulf of Oman mean for oil?
Currency Corner: What does Boris Johnson’s pending victory mean for the pound?
And if you don’t already subscribe to MoneyWeek, do it now – you get your first six issues free when you sign up.
Now, to the charts.
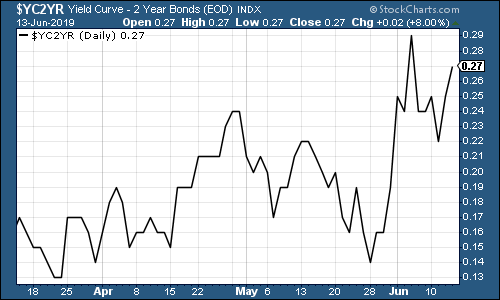
The yield curve (remind yourself of what it is here) ticked higher this week. The chart below shows the difference (the “spread”) between what it costs the US government to borrow money over ten years and what it costs over two.
Once this number turns negative, the yield curve has inverted, which almost always signals a recession (although perhaps not for up to two years).
The curve between the three month and the ten year is still inverted. But with markets betting that the Federal Reserve will cut interest rates, the rate on the two year has been falling faster than the rate on the ten-year. And so the yield curve between those two is steeper than it has been in a while.
(The gap between the yield on the ten-year US Treasury and that on the two-year, going back three months)
Gold (measured in dollar terms) had a solid week, probably helped slightly by geopolitical jitters.
(Gold: three months)
The US dollar index – a measure of the strength of the dollar against a basket of the currencies of its major trading partners – continued to fall as markets continue to believe that a Fed cut is just a matter of time.
(DXY: three months)
The number of yuan (or renminbi) to the US dollar (USDCNY) has crawled closer to the critical 7.0 level that would suggest China might be on the verge of devaluing the currency.
(Chinese yuan to the US dollar: three months)
Ten-year yields on major developed-market bonds were little changed, although Germany continues to plumb new depths of negative yield amid fears for its economy.
(Ten-year US Treasury yield: three months)
(Ten-year Japanese government bond yield: three months)
(Ten-year bund yield: three months)
Copper was little changed this week.
(Copper: three months)
The Aussie dollar – our favourite indicator of the state of the Chinese economy – slipped this week. That’s probably more down to Australia’s weak economy than China’s woes.
(Aussie dollar vs US dollar exchange rate: three months)
Cryptocurrency bitcoin edged (by its standards, at least) higher this week.
(Bitcoin: ten days)
Unemployment is a lagging indicator (it doesn’t start rising until the economy is already getting worse). It’s ticking higher now, with the caveat that it’s still very low.
Eight weeks ago, US jobless claims hit a fresh low on the four-week moving average measure, dropping to 201,500. This week, the moving average ticked higher to 217,750, while weekly claims came in at 222,000, a rise on last week.
US stocks typically don’t peak until after this four-week moving average has hit a low for the cycle, and a recession tends to follow about a year later (always remembering that this is a tiny sample size).
(US jobless claims, four-week moving average: since January 2016)
The oil price (as measured by Brent crude, the international/European benchmark) had a volatile week, with higher-than-expected US crude stockpiles clashing with rising tensions between the US and Iran.
(Brent crude oil: three months)
Internet giant Amazon continued to recover rapidly from its May plunge.
(Amazon: three months)
Electric car group Tesla continued its recent bounce too, in line with the wider market.
(Tesla: three months)
That’s all for this week – have a great weekend.
Oh and if you fancy a bit of weekend listening material, my book, The Sceptical Investor, is available on audio – you can get a copy on Audible here (if you’re in the UK) or here (if you’re in the US).