As Russia’s sell-off deepens, many investors are wondering whether it’s time to buy into the market in the expectation of a quick profit when it recovers. Russian stocks already looked cheap, so by now they must be an absolute bargain. But if that’s what you’re thinking, make sure you understand the risks.
Russia is on the edge of a full-on emerging market crisis. And if that happens, valuation really doesn’t matter. Instead, it’s all about macroeconomics, politics and psychology – and potentially a long wait for things to turn around.
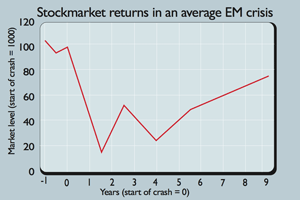
To see what history tells us about buying into this kind of situation, we looked at what happened to stocks during a number of emerging-market crises over the last couple of decades (see below).
While the details of these crises varied greatly, the outcome for markets was surprisingly consistent. If the past proves a good guide, there’s a compelling case for staying away from Russian stocks for now.
How an EM crash plays out
The key factor in this kind of crisis is that the country links its currency to a major currency – usually the dollar – at a fixed or managed exchange rate. This currency peg comes under pressure because of falling trade or investment flows into the country (or rising flows out of it).
The central bank tries to support the peg, by using its foreign exchange reserves to buy its own currency, or by putting up interest rates. This fails and the bank is forced to devalue or abandon the currency peg.
The devaluation hurts the economy (for example, companies with foreign currency borrowings can no longer afford to service them and default) and also inflicts large currency losses on foreign investors. The economy worsens, capital flight increases and markets plunge further.
In most of the major crises we looked at, the stockmarket began sliding several months before the currency peg was broken. The initial crash was an average of 84% in US dollar terms and took around one-and-a half years to reach the bottom (shorter in countries that abandoned currency pegs quickly and longer when the central bank fought to the end).
There was then a rapid rally. But the market generally did not come near to regaining its previous highs: on average, it remained around 50% below the point at which the slide started. Stocks then often spent time treading water for a while once the peak was reached, before selling off once more.
Frequently – but not always – they fell back to near or below the initial bottom (as the chart shows). This was normally more than four years into the crisis. In many cases, it still took a couple more years for a sustained stockmarket recovery to set in.
Why it pays to be patient
The important point here is not the average numbers – which obviously disguise plenty of variation – but the tendency for crises to take more than one attempt to find a sustainable bottom.
There was only one example of a crisis in the sample that did not fit this broad pattern at all: Argentina in 2002, when stocks began rallying as soon as the currency bottomed and never really saw that rally run out of steam.
This meant that investors did not need to time the bottom exactly to make good returns from these crises. A simple strategy of buying the market four years after the initial bottom was hit, actually delivered stronger average five-year returns from that point than the average five-year returns from buying at the bottom of the crisis exactly (217% versus 209%).
Given that the bottom is far easier to spot with a few years of hindsight, that suggests it’s better to sit tight and wait for events to play out fully, than to try to time the turning point in the middle of a crisis.
The typical pattern of an emerging-market crisis
The ten countries included in our calculations were the major emerging market crises of the ‘90s and early ‘00s: Mexico (‘94), Indonesia, Korea, Malaysia, Philippines and Thailand (‘97), Russia (‘98), Brazil (‘99), Turkey (‘00) and Argentina (‘02).
For more recent crises, it’s hard to separate the impact of the global financial crisis and eurozone crisis from what happened within individual emerging markets.
However, Vietnam (2007), Nigeria (2008) and Pakistan (2008) were all examples of stock and currency crashes where domestic issues (such as a banking crisis or a balance of payments crisis) clearly played a key role.
All three seem to be fitting the pattern well, although Pakistan has recovered unusually strongly. Hungary (2008), Ukraine (2008) and the peripheral eurozone economies (2010 onwards) also appear to be following the same trend, although it’s not clear whether these crises are over.
| Average stock returns during ten major EM crises (USD terms) | ||||
|---|---|---|---|---|
| Median | Minimum | Maximum | Median duration | |
| Crash | -84% | -62% | -93% | 1.5 years |
| Rally | 233% | 93% | 630% | 1.2 years |
| Sell-off | -55% | -44% | -76% | 1.8 years |