There are many ways to work out whether a stock is good value or not. But while low pe ratio and price-to-book ratios may help you to spot a cheap company, they are no guarantee it will rise any time soon. So how can you spot turning points in the market? One option is to look at the behaviour of other investors.
It was supposedly a shoeshine boy offering him stock tips that led John D Rockefeller to sell up just before the 1929 stockmarket crash. Rockefeller reasoned that if even shoeshine boys were buying stocks, there soon wouldn’t be anyone left to join the party. So with the US market down 20% from its peak and officially in bear territory, what are various ‘sentiment indicators’ suggesting about stocks now?
Sentiment indicators: investors
Investorsintelligence.com places the views of 100 key professional advisers and financial newsletter writers into ‘bullish’, ‘bearish’ or ‘neutral’ categories. Mike Burke of the website says that adviser sentiment in the last eight months has shown a “similar movement to that seen during the last bottom from July 2002 through March 2003”. A ‘normal’ reading is 45% bullish, 35% bearish and 20% neutral.
The latest shows the bulls on 33.7%, and the bears at 39.3%, leaving 27% neutral. You have a strong ‘buy’, says Jason Van Bergen of Forbes, when bears outweigh bulls by more than 10% – but the gap is just 5.6% now. But it’s also a buy if bulls account for 36% or less of the survey – which they do now.
Sentiment indicators: consumers
Another bullish indicator is US consumer confidence. “The worse consumers feel, the better the gains over the coming year,” says Thomas Lee, chief US equity strategist at JP Morgan. Right now US consumers feel bad – the US Conference Board index hit a 16-year low of 57.2 in May. When this has happened before, says Lee, during the 1973-1975, 1979, and 1981-1982 recessions, or the housing slump of the early 1990s, shares have always rebounded within the next six to 12 months. Michael Kahn in Barron’s also notes that the last time the Consumer Confidence index gave the Dow Jones “such an oversold reading” at the end of October 2005, the market rallied 15%.
Sentiment indicators: fund managers
Betting against fund managers is often a sound idea, which makes Merrill Lynch’s latest poll of fund managers very bullish indeed – investors now have their lowest equity weighting for a decade. A record 60% of managers predict a weakening global economy and reduced corporate profits over the next 12 months.
Sentiment indicators: option traders
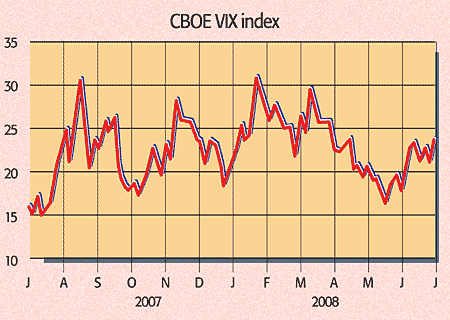
Less bullish, however, is the Chicago Board of Trade’s Vix or volatility index, also known as Wall Street’s “fear gauge” (see chart).
It captures the level of uncertainty reflected in option contract premiums. These contracts allow fund managers to insure themselves against sudden share price movements. A high Vix reading indicates this protection is expensive, meaning those who sell it fear the worst. Right now the index reads about 25, against a year-low of 15 and highs of over 35 – hardly the “maximum fear” territory that indicates a market low and the start of a new bull market.
Overall, various indicators suggest there could well be a bounce on the way. But the longer-term trend in the US suggests the market is now merely continuing a bear phase that started in 2000 with the bursting of the tech bubble – so even if you buy at the right time, you’d have to remember to sell when the next down-swing starts. Investors would be better to get into a market that has been under a cloud for far longer. We’d back the cheap and much-maligned Japanese market before buying America
What bikinis can tell us about markets
Is fashion a gauge of the economy? If so, news isn’t good. According to The Daily Telegraph, sales of ties are up 10% in the past three months as people “smarten up” in the hope of not losing their jobs.
Then there’s hair. Rebecca Camber in the Daily Mail reckons women are “chopping off their locks in line with curtailed spending”. Research from Japan suggests that short hair and bad times arrive together. There’s also the “bull markets, bare knees” theory, which holds that in good times, skirt hemlines rise with confidence levels and vice versa.
But that’s old hat now, says Bespoke Investment Group – these days it’s all about bikini lines. Put an American on the cover of the Sports Illustrated “swimsuit issue” and the S&P 500 rises on average 13.7% a year. Put anyone else there and the rise is only 7.2%. This year’s cover featured US model Marisa Miller – so perhaps good times lie just around the corner after all.