“Even dead cats bounce,” as Barton Biggs of Traxis Partners says in the FT. Last week saw the S&P 500 tumble another 8% and hit an 11-year low, down 52% from last October’s peak, amid increasingly grim economic data. British and European stocks dropped by another 11% to five-and-a-half-year lows. The Vix gauge of US volatility reached a fresh record and the yield on the US two-year note fell below 1% for the first time as investors fled to safety. But then came the bounce, as the US authorities’ bail-out of Citigroup, along with mounting hope of a hefty stimulus package from the incoming Obama administration, helped the FTSE 100 to post its biggest-ever one-day gain on Monday – 9.8%.
Still, while equities jumped, credit investors remained wary. German bond yields barely fell, while dollar interbank rates ticked up for a second successive session on Monday. “This is still first and foremost a credit crisis,” says Tony Jackson in the FT. So if the two markets disagree, “go with credit”. What’s more, a “relief bounce” will need to feed on firmer economic data if it is to endure, says Mark Lovett of RCM. Unfortunately, we’re getting exactly the opposite.
The economic news is “dreadful”, says Economist.com. World trade has suffered a sudden contraction; German business confidence has plunged to a 15-year low; and German GDP looks on track for its largest fall in the post-war period, according to Citigroup. Across the Atlantic, weekly jobless claims have reached their highest level since the early 1990s and the house-price slide shows no sign of bottoming out. The median sales price of existing homes was down by an annual 11.3% in October, according to the National Association of Realtors – the steepest fall on record. Mortgage availability has fallen and the “supply overhang is still huge”, says Joshua Shapiro of MFR Inc. That will make America’s highly indebted and savings-short consumers even less likely to spend.
A key element of the downturn on both sides of the Atlantic is banks’ reluctance to lend. That’s set to continue now that, following losses on credit instruments, they face further write-downs, due to the recession. Banks will have to raise more money or decrease lending to deal with these. This week, a British think tank estimated that high-street banks could require another £110bn to resume normal lending.
Retrenching consumers, plunging commodities, and the lending squeeze all add up to the makings of a “perfect deflationary storm”, says John Mauldin on Investorsinsight.com. US GDP could fall by 5% in the fourth quarter, reckons Goldman Sachs, which also sees profits across the economy declining by 25% in 2009, the biggest drop since 1938.
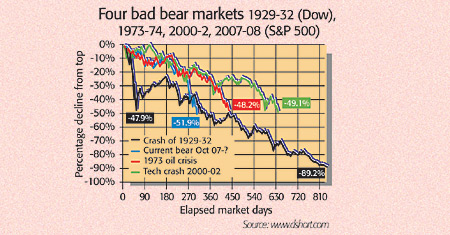
The fact that poor corporate and macroeconomic reports still send stocks down means the bad news hasn’t been fully discounted, so the bottom isn’t here yet, reckons Biggs. There is certainly still scope for further disappointment: American earnings are still expected to rise in the first quarter and German profits are apparently set to rise by 16% in 2009. Taking a longer-term view of stockmarkets also suggests that the bear trend isn’t over. The S&P 500, which sets the tone for world markets, breached its late-2002 low last week. This makes it clear that the multi-year market upswing that ended in 2007 can be dismissed as “an aberration”, says John Authers in the FT – it was a major bear-market rally in a long-term downtrend.
But even without the fall to new stock-price lows, the bear had unfinished business. Markets move in long up and down cycles, with long-term, or secular, bear and bull markets lasting around 15 years on average. The key gauge of these cycles is valuation, with p/e ratios sliding from overvalued levels far above the long-term average of around 15, down to single digits. This pendulum swing to extremely undervalued levels paves the way for the next upswing. The typical pattern for secular bear markets is a gradual slide in valuations, with markets trading broadly sideways as earnings catch up with valuations. During the 1966-1982 bear market, for example, the markets saw upswings and downswings of 36%-73%, but overall just drifted sideways, says Adam Hamilton on Zealllc.com. During this time the p/e slowly fell to single digits.
The last secular bull for the S&P was 1982-2000, taking p/es from seven to a record 44. They then fell as the post-2000 bear began; by the 2002 low the p/e was at 25 and at the peak of the market rally last year it was 21, says Hamilton, so mean-reversion is ongoing. In short, the market and valuation patterns since 2000 have been very similar to the first half of the 1966-1982 episode. And there’s some way to go before this secular bear market is over, as the trailing p/e is currently around 18.
In Britain, too, p/es didn’t hit the single digits that precede a long-term bull market in 2003, and the primary bear market isn’t over yet, says John Robson of Full Circle Asset Management. European p/es are back to mid-1980s levels of around eight, but as Dresdner Kleinwort notes, they were even lower – less than seven – in the early 1980s. As Albert Edwards of Société Générale puts it, “there is no need to rush to buy now”.