As we never tire of saying, when you don’t know, then technical analysis will, more often than not, provide the answer. Genuine students of technical analysis live in an osmosis-driven world where the price action of all financial assets is constantly monitored over both long and short periods; this process delivers a deep understanding. If you know what’s happening to the price of everything, you know when someone says something wrong. It’s the same experience as hearing a piece of music for the first time and a member of the orchestra plays a wrong note; without knowing the piece, you still know it was a wrong note.
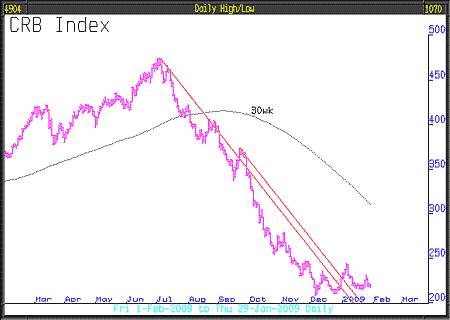
From the chart of the CRB Index of commodities, it can be seen that the collapse may have stopped, near enough to the long-term lows to be considered to be a level of technical support. If we look at the daily chart, we can see that the character of the chart has changed. From June last year the price fell steeply, with only modest upward retracements immediately followed by steep falls. Since December 2008, however, the price has gone sideways in a trading range and the downtrend has been taken out. Could this be the point of reversal?
There are only two possible outcomes, the CRB resumes its path downwards, or it reverses. We might therefore be close to a potential signal of a reversal which would imply commodities coming back into demand, and that would likely mean increased economic activity and maybe a return to strength in asset markets or, and this would be very bleak indeed, the CRB price falls through the bottom of the range, in which case we would expect the economic ice age to get worse. Just studying these charts day by day, can deliver critically important insights about much more than just the price of wheat or copper.
The oil price chart is not dissimilar – in a trading range at long-term technical support. This range will lead to an investment opportunity. We can buy oil-related investments to benefit from the rising oil price should it break above $50, the top of the trading range, or if the price falls below the range low of $32.40, we can buy an ETF that works on the short side of the oil price that will go up in value as the oil price goes down. One of these two options is a very likely future investment for the model portfolio. Because trading ranges always end, this will lead to an opportunity.
The Chinese say it’s the year of the Ox, we say it’s most likely the year of gold. Governments are dedicated to increasing the amount of money in circulation and borrowing on a scale never before seen, because of this investors will look for a safe haven. Where else would they go but to gold bullion or gold-related investments? Demand should prove to be insatiable and the gold bull market will be legendary.
The other side of the gold equation is supply, here the news is also very bullish:
• South African gold production at its lowest level since 1901. Down 14% versus 2007.
• GFMS Gold Consultancy say mine production down 4% to 2,385 tonnes, the lowest since 1995.
• According to BlackRock, managers of the Gold & General fund, central bank sales last year were down 42.5%.
• In Europe and the UK, investors are pouring into gold ETFs. For the first time ever, gold ETFs hold above 40m ounces.
The chart for gold bullion has made a sensational break out of its downtrend, having bottomed last October and since risen 34%. This is the kind of chart that investors should drool over. The fundamental story is exciting and the technical activity elating.
• This article was written by John Robson & Andrew Selsby at Full Circle Asset Management, as published in the threesixty Newsletter on 30 January 2009.