At last it feels like a bull market again. Every major stock market in the world ended last week in the black, making this the most convincing rally we’ve seen in a long time.
In Asia, Hong Kong, Singapore and Vietnam all posted double-digit gains, with Singapore up more than 15%. After a hesitant start to 2009, investors seem to have cast aside their doubts and dived back in. No more ‘safety-first’ investments; government bonds are slowly losing their appeal. But can this euphoria last?
In the long run, I’m on the side of the optimists. Asian equities are still a bargain at these prices. There is more and more good news mixed in with the bad on the global economy. And this rally is broader and sounder than anything we’ve seen since the peak in 2007.
But I still have doubts. Let’s look at the wider picture…
Asia has outperformed in this rally
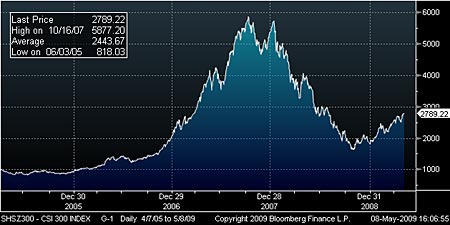
Global equities have staged a strong rebound in the last few months. China has been one of the world’s top performers – the CSI 300 is up almost 70% since it bottomed at the start of November.
China has been exceptional – being largely closed to foreign buyers, the market is more detached from trends elsewhere. Most other Asian markets held above their October/November lows, but didn’t stage a convincing recovery until the S&P 500 bottomed in early March.
But overall Asia has performed strongly in the second half of this crisis after being among the worst hit regions in the early stages. As you can see below, the MSCI Asia ex-Japan (orange line) has outperformed the S&P 500 (white line) since the end of October.
But is this just a bear market rally or the start of a new bull run? We can’t answer that by focusing on equity markets alone, so let’s look at some broader trends.
Credit markets are improving too
First, there are encouraging signs in the credit markets, which weren’t there when I wrote about the impending rally back in January. The chart below shows the spread between the average yield on investment grade bonds in the JP Morgan Asia Credit Index and US Treasuries. As you can see, this spread has narrowed sharply since the start of March – in other words, investors are demanding a lower risk premium to hold these bonds.
The improvement for the high yield (also known as speculative, junk or non-investment grade) bonds in the index has been even greater, as the next chart shows. Asian high-yield bonds have been one of the stars of the debt markets since the crisis peaked: the JACI non-investment grade section has paid investors a total return (coupon payments and bond price rises/falls) of 32% over the last six months, compared with 15% for the Merrill Lynch US High Yield Master II Index, the US junk bond benchmark.
New borrowing costs are coming down
However, for a sustained recovery we also need to see signs of a broad easing in credit conditions. The good news is that there’s lots of evidence that things are getting better.
The chart below shows the three-month US dollar Libor-OIS spread, which measures the difference between the three-month London interbank offered rate – the rate at which banks can borrow dollars in the interbank market – and the three-month overnight indexed swap rate (basically the expected average Federal Reserve base rate over the next three months).
Under normal circumstances the gap between the two is very small – typically around 10 basis points (bps – one-hundredth of a percentage point). But in times of crisis, when banks are nervous about lending to each other, Libor spikes and the spread blows out as it did last year.
In reality, lending absolutely froze and banks became dependent on central banks for short-term financing. But the spread is now finally back under 100bps and still falling, which suggests things are very slowly returning to normal.
It’s not just banks. Many companies use the commercial paper market for short-term loans for working capital. The chart below shows the spread between rates for AA (high investment grade) and A2/P2 (bottom of investment grade) non-financial commercial paper borrowers in the US market.
As you can see, the spread spiked late last year, but is now falling. This shows that medium-quality borrowers are now being allowed back into the market at more reasonable rates.
So why, despite the improvements, am I not convinced that we’ve seen the end of the bear market?
Asia is cheap, America is not
My doubts are partly down to valuations, which never got to the kind of lows that tend to mark a definitive bottom. As Citigroup’s Asia strategist Markus Rosgen points out, one of the most consistent indicators we have for Asia is the price/book value ratio. As you can see on the chart below, the MSCI Asia ex-Japan has tended to cycle between a p/bv of around one when gloom is at its highest, to around three when the bubble peaks.
This time round, the lowest we got to was 1.08, and that very briefly in October (so briefly it doesn’t even show on the monthly-average chart above). I would have preferred to see a sustained low in the region of 0.9, which was the bottom in aftermath of the 1997-1998 Asian crisis.
Of course, this crisis wasn’t ‘made in Asia’. The region’s banking systems are generally in good shape and economies aren’t burdened with debt, unlike the West. So there’s a good argument for Asia not plumbing the same depths in its homegrown crisis.
But I don’t think that the same can be said of the US. A few weeks ago (It’s almost time to turn bullish on stocks), I noted that even the long-overvalued American market now looked like fair long-term value. But it certainly isn’t cheap.
US market valuations have historically bottomed on a cyclically adjusted price/earnings ratio (CAPE) in the single digits. But as the chart from Capital Economics below shows, this time the CAPE has only got back to its long-term average, from being hugely overvalued at the peak of the dotcom bubble. Other long-term measures such as Tobin’s Q, which aims to compare the market value of a company with the replacement value of its assets, come to similar conclusions
Of course, this is just a past relationship, not an iron-clad rule. It’s possible that markets could bottom substantially higher than usual this time – I just think the odds are against it.
Also, we don’t necessarily need another huge down leg to take CAPE to single digits. Instead, we might see a sluggish market that rises more slowly than earnings over the next few years. That’s what happened in 2003-2007 – while the market rose, earnings rose even faster and CAPE continued to fall.
The worst may be over, the recession is not
So valuations argue against investing too heavily in the US market for the long-term right now, but they don’t necessarily tell us another down leg is coming soon. My main concern there is sentiment. There seems to be a growing consensus that the worst is past and that recovery will begin soon – perhaps as soon as the second half of this year.
I agree the worst is probably past, in that the speed of the decline is slowing. The data certainly suggests that, as I mentioned recently here (Why Asian investors are more upbeat than Europeans) and here (China’s growth is up sharply). And it’s likely we’ll see positive GDP numbers popping up over the next few months: South Korea unexpectedly grew slightly in the first quarter. But I think rapid recovery and a return to ‘normal’ – in the sense of a pre-2008 ‘normal’ – is unlikely.
I’ll try to look at what the next few years might offer in next week’s email. But in short, I think it’s likely to be a longer recession, a more sluggish recovery and a rather different ‘normal’ to what the markets expect. If I’m right, markets may sell off again once it becomes clear that the V-shaped recession isn’t going to happen.
For a glimpse of how cruelly expectations may be dashed, take a look at the chart below. This shows the path of earnings for the MSCI Asia ex-Japan in the last four downturns plus the consensus forecast for the current slump. The current recession will apparently be the second-shortest and shallowest in the last 30 years. As Rosgen puts it, these forecasts “certainly don’t jive with this being the worst economic downturn this side of WWII”.
It’s a similar story in most other markets. According to Andrew Lapthorne of Société Générale, the consensus forecasts for the US and Europe point to a -22.4% earnings decline in 2009 for non-financial firms, followed by a +20.6% (US) and +15% (Europe) recovery in 2010. As he points out, that’s unlikely: it will be hard for firms to rebuild margins quickly during the kind of sluggish recovery that we face.
So while I think this rally has a bit further to run – and I think there’s very good long-term value in many equity markets, regardless of what happens in the short term – I’m still expecting at least one more sell-off later in the summer.
In other news this week …
| Market | Close | 5-day change |
|---|---|---|
| China (CSI 300) | 2,789 | +6.3% |
| Hong Kong (Hang Seng) | 17,390 | +12.0% |
| India (Sensex) | 11,876 | +4.1% |
| Indonesia (JCI) | 1,863 | +7.7% |
| Japan (Topix) | 895 | +5.7% |
| Malaysia (KLCI) | 1,027 | +3.6% |
| Philippines (PSEi) | 2,242 | +6.6% |
| Singapore (Straits Times) | 2,242 | +16.6% |
| South Korea (KOSPI) | 1,412 | +3.1% |
| Taiwan (Taiex) | 6,584 | +9.9% |
| Thailand (SET) | 528 | +7.3% |
| Vietnam (VN Index) | 366 | +13.9% |
| MSCI Asia | 89 | +7.6% |
| MSCI Asia ex-Japan | 367 | +9.2% |
There wasn’t much good news on the corporate front. Toyota, the world’s largest carmaker, cut its annual dividend for the first time ever and estimated that its loss this year will total Y550bn ($5.5bn), twice the consensus forecast.
Meanwhile, plummeting sales and prices in the electronics industry are forcing manufacturers to raise fresh cash to shore up their balance sheets. Toshiba, Japan’s biggest chipmaker, plans to raise ¥493.5bn ($5bn) from issuing new shares and bonds to fund investments, after making a record loss of ¥323.6bn last year. Korean peer Hynix plans to raise Won724.5bn ($590m) in equity after losing Won4.77trn in 2008.
The economic news was mixed. Taiwanese exports were weaker than expected in April, at -34.3% year-on-year, only marginally better than -35.7% yoy in March. However, while US and European shipments were weak, exports to China improved to -34.6% yoy from -44.4% yoy.
Chinese car sales also suggest that the recent rebound there is still holding up; sales were up +37% year-on-year last month, helped by government subsidies for minivans and small cars. However, power consumption was down -3.6% yoy in April, a step back from -2.1% yoy in March.
• This article is from MoneyWeek Asia, a FREE weekly email of investment ideas and news every Monday from MoneyWeek magazine, covering the world’s fastest-developing and most exciting region. Sign up to MoneyWeek Asia here