Importantly, this fortnightly investment letter is about two issues. Firstly, to explain how we limit loss-making investments so as to protect capital; secondly, to show how we search out profitable investments so as to make investment gains.
Our team works diligently using the tools of fundamental analysis (researching the truth) and technical analysis (charts and what’s happening to prices).
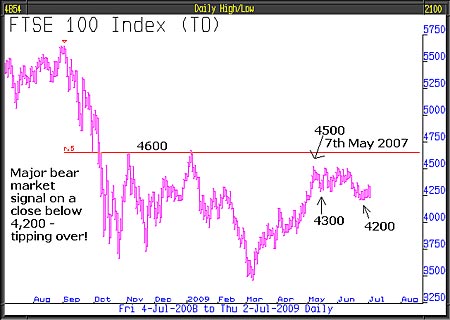
We believe that the stock market rally that started 9 March has now ended and, so far, what has followed is a deteriorating stalemate, prices heading sideways/downwards. In the previous issue, we said that the break that had taken place below 4,300 was the signal that the bear market had resumed its downward path. All of this, to our mind, signals a tipping point – or might we say a tipping-over point – from where, on FTSE weakening below 4,200, fear will return and selling will accelerate.
Alan Greenspan, in the Financial Times on 26 June, wrote this:
“The rise in global stock prices from early March to mid June is arguably the primary cause of the surprising positive turn in the economic environment. $12,000 billion newly created corporate equity value has added significantly to the capital buffer that supports the debt issued by financial and non-financial companies.
“Corporate debt, as a consequence, has been upgraded and yields have fallen. Previously capital-strapped companies have been able to raise considerably debt and equity in recent months. Market fears of bank insolvency, particularly, have been assuaged. Is this the beginning of a prolonged economic recovery or a false dawn?”
Later on in his article, Greenspan wrote:
“I recognise that I accord a much larger economic role to equity prices than is the conventional wisdom. From my perspective, they are not merely an important leading indicator of global business activity, but a major contributor to that activity, operating primarily through balance sheets. My hypothesis will be tested in the year ahead. If shares fall back to their early spring lows or worse, I would expect the “green shoots” spotted in recent weeks to wither.”
In those words, Greenspan neatly illustrated George Soros’s Theory of Reflexivity, explained in his book The Alchemy of Finance published in 1987:
1. Markets are always biased in one direction or another.
2. Markets can influence the events that they anticipate.
Much of the less-bad data that gave support to asset prices and the hope of an end to the bear market came about as a result of stock markets rising, if the economy continues to get better, stock markets should continue to improve – that’s reflexivity at work. If, however, the stock market for its own good reasons should fail here, all of that good sentiment and improving economic data will quickly reverse and the investment climate will get worse – that’s also reflexivity working.
It has been reported that, in the second quarter, output per UK worker fell 4.2% following a decline in the first quarter of 1.8%. This suggests that companies are hoarding labour so as to benefit by as much as possible from the growing economic recovery. If the stock market falls from here and the “green shoots” wither, that hoarding of labour will dramatically end and job losses will accelerate alarmingly – a consequence of reflexivity.
Senior executives (insiders) of S&P500 companies, in June, sold 21 times more stock than they bought: sales of $2.6bn compared to purchases of $120m. This information was provided by Trimtabs Investment Research Company and adds a grim dimension to the latest stock market action.
Warren Buffett, whose business empire includes majority holdings in many large privately-owned companies, said recently:
“I get figures on 70-odd businesses, a lot of them daily. Everything that I see about the economy is that we’ve had no bounce. The financial system was really where the crisis was last September and October, and that’s been surmounted and that’s enormously important. But in terms of the economy coming back, it takes a while. There were a lot of excesses to be wrung out and that process is still underway and it looks to me like it will be underway for quite a while. In the [Berkshire Hathaway] annual report, I said the economy would be in a shambles this year and probably well beyond. I’m afraid that’s true…”
The economic crisis is a financial one and the saving of the banking system was crucial. Had the authorities not bailed out the banks, the disaster following the Lehman Brothers collapse would have been cataclysmic. The huge economic stimulus required to rescue the banks and to restore stability has myriad unforeseen consequences, many of which will not be good – it’s like a mass drug trial to cure a new lethal and contagious disease, where the unknown risk from the treatment is potentially less dangerous than doing nothing – in effect a real-life experiment.
Preventing the banking collapse and the subsequent sharp rise in the value of banking stocks drove the March rally. Generally speaking, banks were the leaders up, so they are likely to be the leaders down. The chart showing comparative performance since the beginning of May, of FTSE compared to the banking sector, demonstrates graphically that the banking sector is the leader and, of late, is doing rather badly. Since 7 May it is down 8% – double FTSE’s 4% loss. This gem of a chart offers valuable insights that may be very important going forward. The implications from our assumptions, if correct, are very bad for future stock market performance but very good for our RBS Bear Note and, probably, UK gilts.
The great thing about technical analysis is that by focusing on key levels at crucial moments such as now, it becomes possible to accurately identify points where investment views are subject to change or confirmation. For example, if FTSE recovers to above 4,500/4,600, the Bear Note investment would be in question. Conversely, a close below 4,200 and the gap between the performance of banks and FTSE worsening would be in support of our bearish view. FTSE above 4,500/4,600 would be a signal that our China investment, potential investments in other emerging markets, Japan, possibly Australia and commodities will all become very attractive. We will quickly realise that and adjust the model portfolio in order to benefit.
We include three charts for the Japanese Nikkei Dow.
Long-term monthly chart
First and foremost, this chart is a ‘beware signal’ to any investor who thinks that stock markets in the long run always pay off, because we are still in the depths of despair almost twenty years after the December 1989 high. However, the Nikkei may have bottomed out.
Weekly chart
The downtrend from 2007 is where the recent rally stalled at the 10,000 level.
Daily chart
Whilst the chart remains below the downtrend, we have no interest; however, a move above 10,000 would automatically take the price through the downtrend and deliver a valuable buy signal.
If, as we fear, the major markets of the world are about to suffer a return to bear market conditions, will Japan be more influenced by that or by markets such as China which might continue its bull run in spite of what’s happening in the developed world? The answer will be delivered by the price action over the next period.
One thing we can say with certainty is that Japan is long overdue its next bull market – so when it gets under way we want to own it.
• This article was written by
Full Circle Asset Management
, as published in the
threesixty Newsletter
on 3 July 2009