Last week’s Economist cover hailed “Asia’s astonishing rebound”.
Asia’s economies are growing at double-digit rates at a time when much of the rest of the world is mired in recession. But in fact, there’s nothing astonishing about this. As I’ve noted many times in the last few months, Asia was always set to be the first out of recession as soon as the global economy stabilised, and was likely to rebound pretty quickly once the turn came.
But investors mustn’t get too carried away. This pace won’t be sustained for one thing. Asian exports collapsed late last year as the world went into freefall, so a rebound as companies restocked and trade recovered somewhat was inevitable. That’s a short-term boost. Progress will remain solid, but it’ll slow down after a quarter or two of this.
More importantly, this is not a reason to chase every Asian market and stock, as the hot money is now doing. Investors need to be selective and avoid the biggest investment sin of all – paying too much for growth …
Fast growth doesn’t always mean soaring stocks
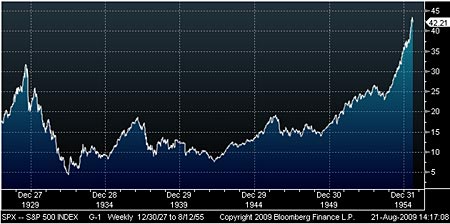
Fast growth does not necessarily mean good stock market returns. As Russell Napier points out in his book Anatomy of the Bear, between 1899 and 1921, US GDP grew by a nominal 383% and a real 88%. Yet on the 24 August 1921, the Dow Jones Industrial Average closed at 63.9, a level first reached on 27 January 1899.
The intervening years had seen a choppy, ranging market – most notably the huge run up in the market and corporate profits in 1916 as the war in Europe created a huge boom for American manufacturers. But the net change over the whole two decades was zero.
This holds a crucial lesson for investors. Where you’re going is not the whole story – where you start matters even more. In 1899, stocks traded on frothy valuations, setting investors up for poor long-term returns, regardless of the huge economic progress. On the other hand, when they finally bottomed in 1921, it was at cheap valuations that set up a huge – ultimately disastrously overheated – bull market that ran all through the twenties.
Generally speaking, it takes a long time for the excesses of a bubble to shake out and for valuations to fall to the point where a new bull market can begin. While economies can recover often quickly, it usually takes much longer for markets to get back on track. Let’s take a look at a look at what we can learn from the aftermath of several big crashes.
Three big bear markets
When investors think of bear markets, three usually spring to mind. One is the shattering crash of the Great Depression, when stocks dropped remorselessly for three years before bottoming in 1932. This was followed by a relatively solid recovery: while progress was later delayed by World War II, shares never again returned to their depression lows.
The second is the bursting of Japan’s bubble in 1989. This also dropped away over three years before rebounding. Many investors thought that this marked the low, yet it continued to reach fresh lows for the next two decades.
Lastly, there’s the S&P 500 (and other western benchmarks) in recent years. After the dotcom crash, the market declined for two years, traced out a double bottom, then rebounded in a very consistent rally over the next four years, before selling off again to hit a 13-year low in March.
If you look at each of these individually, you’d draw different lessons from them. But this could be a mistake. While investors tend to think of the depression and the most recent bear market as classic booms and busts, they are actually unusual. In fact, the only one that can be described as a ‘typical’ bear market is Japan – dozens of burst bubble examples trace out this kind of pattern.
What was different about the Depression?
The Great Depression is easiest to see. With the economy in freefall, confidence collapsing and the banking system imploding, the index fell from being substantially overvalued to very undervalued in just three years. The chart below from consultants Smithers & Co shows two measures of long-term equity valuation, the cyclically adjusted price/earnings ratio and the q ratio; as you can see the market has never moved between extremes of over and undervaluation as rapidly as it did then.
What about the most recent bubble?
What happened in the most recent bear market is a bit more complicated. But if we delve a bit more deeply into what happened, we can break it down into two separate booms and busts.
The first chart below shows the annualised gains and losses for each sector in the Russell 3000 benchmark, while the second one shows the percentage contribution that each sector made to the overall market gain or loss in the period – in other words, the main drivers of the gains or losses in the market over each period. (If you’re not familiar with the Russell 3000, it’s a broad index of stocks that covers around 98% of the US market; I’m using it instead of the more commonly quoted S&P500 because Russell provides a consistent set of sector indices back to 1995.)
As you can see, the first up leg (the dotcom bubble) was driven by technology stocks. Financials also did well in an environment of declining real interest rates. When the bust came, technology was wiped out, but financials survived relatively well thanks to the Federal Reserve under Alan Greenspan slashing interest rates to new lows. This created a housing and lending bubble and superb conditions for financials to earn huge profits (though ultimately phantom ones).
Thus financials continued to grow in importance and became a key driver of the second-half rebound. Technology also contributed as some of the ideas created in the internet bubble became reality. However, the sector came nowhere near to eradicating the losses suffered in the aftermath of the bust.
As we all know, energy boomed too, while consumer discretionary stocks thrived as cheap credit fuelled conspicuous consumption. You can also how healthcare quietly enjoyed more than a decade of outstanding returns as America’s dysfunctional and horrendously expensive medical system grew fat on ageing boomers.
So essentially, we have a three-stage trainwreck: a technology bubble, very much in the classic Japan-style mould (the white line); a financials bubble that was sustained beyond its normal lifespan by cheap credit (the yellow line); and the consumer spending bubble that grew from that (the red line). On top of that we had an additional boost from have healthcare, energy and so on.
The three Asian bubbles you should be wary of
So why is this breakdown important to investors in Asia? Because, while Asia as a whole was not in a bubble by late 2007 (although many stocks had certainly become expensive), there were three apparent bubbles: the mainland Chinese market, India and Vietnam, as you can see on the charts below.
China’s CSI 300 Index since 2005
The Bombay Sensex Index since 1999
The Ho Chi Minh stock index since 2001
This is important for investors who see the Asian recovery and want to profit from it. In general, investing in the aftermath of a bubble that has not undergone the long march towards cheap valuations will not give you good returns, even if the economy booms. Take a look at the performance of Taiwan’s Taiex after an enormous bubble there burst in 1990, despite continued strong economic growth for next two decades.
Now the point is, this is the normal outcome, so it’s what we’d expect after these bubbles burst too. The question is: have any of them corrected so quickly that we can expect a 1932-recovery or a second bubble, as in the post dotcom era?
Which Asian stock markets will be stuck in bear recovery mode?
The table below summarises valuations in the last five years for benchmark Asian indices. I’ve looked at both price/earnings and price/book ratios, because earnings can swing rapidly during a recession like this, rendering p/e less useful (look at Taiwan’s p/e of 93 times and Japan’s negative earnings, for example). Book values are more stable, though not infallible.
| P/E peak | P/E low | P/E now | P/E f/c | P/E av | P/B peak | P/B low | P/B now | P/B av | |
|---|---|---|---|---|---|---|---|---|---|
| China (CSI300) | 52.84 | 10.93 | 31.35 | 22.65 | 25.66 | 7.89 | 1.73 | 3.3 | 3.26 |
| China (HSCEI) | 31.31 | 6.11 | 18.69 | 15.56 | 14.8 | 5.44 | 1.01 | 2.27 | 2.38 |
| Hong Kong (HSI) | 22.21 | 6.55 | 21.14 | 17.24 | 14.03 | 3.34 | 1.01 | 1.95 | 1.99 |
| India (Sensex) | 24.96 | 8.06 | 18.35 | 17.85 | 17.41 | 6.39 | 1.72 | 3.31 | 3.83 |
| Indonesia (JCI) | 31.08 | 6.48 | 30.03 | 14.65 | 16.34 | 3.85 | 1.24 | 2.59 | 2.41 |
| Japan (Topix) | 29.48 | 10.79 | -1.28 | 41.19 | 20.13 | 2.09 | 0.8 | 1.17 | 1.57 |
| Malaysia (KLCI) | 20.67 | 8.63 | 20.26 | 16.84 | 14.31 | 2.4 | 0.86 | 1.98 | 1.8 |
| Philippines (Pcomp) | 17.26 | 8.75 | 16.17 | 13.38 | 13.54 | 2.9 | 1.16 | 1.91 | 1.93 |
| Singapore (STI) | 21.07 | 5.27 | 19.77 | 16.46 | 13.17 | 2.15 | 0.78 | 1.52 | 1.84 |
| South Korea (Kospi) | 34.52 | 6.94 | 34.14 | 14.18 | 14.27 | 1.8 | 0.72 | 1.25 | 1.26 |
| Taiwan (Taiex) | 95.3 | 7.73 | 92.93 | 23.09 | 19.95 | 2.69 | 0.97 | 1.63 | 1.6 |
| Thailand (SET) | 25.78 | 6.13 | 25.24 | 11.76 | 12.54 | 2.32 | 0.81 | 1.4 | 1.74 |
| Vietnam (VNIndex) | 46.3 | 7.83 | 19.64 | 17.51 | 22.18 | 9.86 | 1.19 | 2.59 | 4.09 |
| MSCI Asia | 155.36 | 8.88 | 151.15 | 26.23 | 22.01 | 2.23 | 0.93 | 1.48 | 1.75 |
| MSCI Asia ex Japan | 23.32 | 7.08 | 22.5 | 17.91 | 14 | 2.94 | 1.03 | 1.88 | 1.89 |
The only one of the three that looks like it plunged to bear market bottom lows is Vietnam; as you can see in the table, it bottomed at a p/b of 1.19 times. Added to the fact that this is a relatively small and immature market and the economy is still in the early stages of developing, I think that this will turn out to be low enough to provide investors with good returns in the medium term.
On the other hand, China certainly doesn’t look as if the CSI 300 fell low enough to mark a true bear market bottom. India is a bit more borderline. Based on its p/e, it wasn’t as severely overvalued as China. However, the peak p/b of 6.39 is very high and definitely looks bubbly; one possible way to explain this apparent contradiction would be if earnings for firms in the Sensex were unsustainably high relative to the rest of the economy at the peak, and thus their share of future profits would be lower.
Be careful when picking exchange-traded funds (ETFs)
Overall, I suspect that investing directly in China and India through exchange traded funds that track the domestic benchmark (or one of the many managed funds that effectively track it, whatever they claim to do) probably won’t give the best returns. You’d probably make money, but your returns are likely to lag behind the overall growth of the economy.
If you plan to invest in ETFs, instead focus on some of the cheaper markets. While they may grab fewer headlines than the emerging giants of China and India, they are still set to grow with them. In addition, the Hang Seng China Enterprises Index (HSCEI) of Hong Kong-listed Chinese stocks, while definitely bubbly at the peak, looks like it may have fallen far enough to deliver good returns. For India, the choices are slimmer, although the Wisdom Tree India Earnings ETF (mentioned in my recent reviw of Asia ETFs), which overweights cheaper stocks in the index, might be a better alternative to a straightforward tracker.
Of course, there is always the prospect that easy money policies will create an even bigger second bubble in China or India, as it did in the West after the dotcom bust. And Western central banks’ desperate efforts to reignite their economies through quantitative easing could lead instead to huge bubbles across Asia, as that money seeks better opportunities.
If it does, investors in Asia will make some spectacular gains over the next few years. Personally, I hope this doesn’t happen – we’re currently seeing the appalling damage that reckless central bankers can do to the economy. But if it happens, we’ll need to be able to recognise it, to profit from it, and then get out before the party is over.
In other news this week …
| Market | Close | 5-day change |
|---|---|---|
| China (CSI 300) | 3,204 | -4.2% |
| Hong Kong (Hang Seng) | 20,199 | -3.3% |
| India (Sensex) | 15,241 | -1.1% |
| Indonesia (JCI) | 2,334 | -2.2% |
| Japan (Topix) | 947 | -2.7% |
| Malaysia (KLCI) | 1,164 | -2.1% |
| Philippines (PSEi) | 2,720 | -4.6% |
| Singapore (Straits Times) | 2,545 | -3.3% |
| South Korea (KOSPI) | 1,581 | -0.7% |
| Taiwan (Taiex) | 6,655 | -5.9% |
| Thailand (SET) | 645 | -1.5% |
| Vietnam (VN Index) | 519 | +2.4% |
| MSCI Asia | 100 | -2.2% |
| MSCI Asia ex-Japan | 420 | -3.0% |
In Taiwan, one minister resigned and two others offered to step down after criticism of the government’s slow response to Typhoon Morakot. Several hundred are dead or missing after the typhoon hit two weeks ago. Perceived mishandling of the crisis has caused president Ma Ying-jeou’s approval rating to plummet. While the disaster is unlikely to have much effect on the Taiwanese economy, the damage to Ma’s reputation could make it more difficult for him to continue with his agenda of better relations with mainland China.
Indian healthcare firm Wockhardt Hospitals is reported to be selling 10 hospitals to rival Fortis Healthcare, in an effort to pay down debt after failing to raise new capital through an initial public offering last year. The proceeds may also be used to bail out Wockhardt Limited, a listed pharmaceuticals business that is partly owned by the founders of Wockhardt Hospitals and recently defaulted on loan payments. Fortis is currently number two in the fast-growing Indian healthcare business, behind Apollo Hospitals.
Air China, the country’s largest airline, is increasing its stake in Hong Kong’s Cathay Pacific to 29.99% by buying part of conglomerate Citic Pacific’s 17.49% shareholding in the carrier. The deal looks like a cheap way for Air China to expand, after it failed in an effort to take over domestic rival China Eastern Airlines last year. Swire Pacific, another conglomerate, will also buy part of Citic Pacific’s holding, lifting its stake to 41.97%.
• This article is from MoneyWeek Asia, a FREE weekly email of investment ideas and news every Monday from MoneyWeek magazine, covering the world’s fastest-developing and most exciting region. Sign up to MoneyWeek Asia here