Dividends matter – a lot. Research from Barclays Capital shows that, since 1925, 44% of the overall return from S&P 500 shares came from reinvested dividends. Anyone who thinks that sounds high should remember that every £1 of dividends reinvested in shares in 1941 has had 70 years to compound upwards at the same rate as stocks have grown over that period. Effectively, by reinvesting, you are getting paid dividends on your dividends.
And according to Graham Secker at Morgan Stanley, now could be the perfect time to snap up a dividend bargain. Its latest research points out three ways to identify dividend gems.
1. Low payout ratios
A payout ratio is simply a dividend-cover ratio turned on its head. Let’s say a firm generates profits before dividends (profit after tax, normally) of £100m. The dividend pay-out for the year comes to £25m. Dividend cover – a measure of how secure this year’s dividend payment is and therefore whether the firm is likely to be able to repeat it next year – is four times (£100m/£25m). As a rule of thumb, you’re ideally looking for a ratio of two or above (the higher, the better).
The payout ratio just flips this calculation around. If the dividend is £25m and total profits available to shareholders (that’s after charges such as bank interest and preference dividends) are £100m, the payout ratio is 25%.
So how do payout ratios look now? According to Secker, across Europe “the dividend payout ratio has room to rise from very low levels”. Specifically, many solid blue-chip stocks have 12-month forward payout ratios that are within 20% of their ten-year lows. Why is this important? Because it looks as though these firms have “the potential to raise their payout ratios materially”. In other words, their dividends have room to rise substantially.
That’s good news, because “companies that produce strong dividend growth tend to outperform the market over time”. Indeed, Morgan Stanley’s research shows that stocks in the top quartile of dividend-growers go on to rise by an average of 22% per year compared to just 9% for the wider market. But here’s the killer statistic: the “hit ratio for dividend growers is 100%”. What that means is that, since 1997, the average stock in the top quartile of dividend-growers has always outperformed the average stock in the market.
Now, as Secker concedes, a firm with a low payout ratio may opt not to raise its dividend – it may need the cash to invest in the business instead. But it’s a good starting point. And the argument gets more powerful when you combine a low payout ratio with two other factors.
2. High, secure dividend yields
Dividend yields tell you, as a percentage, what income return you are getting from a stock. So if a firm pays out a dividend of 2p per share and the current share price is 100p per share, then the yield is 2%.
So how to spot a solid yielder? After all, a company that is generous this year could slash its dividend next year. Morgan Stanley looks for stocks with a current yield of over 4%, where its analysts believe the risk of a cut (based on analysing other factors, such as cash-flow strength – see page 40) is low over the next two years.
Better still, the stocks on the shortlist are cheap compared to the average European stock, based “on both trailing dividend yield and price to earnings ratios (p/e)”. In short, there are decent yields about and you can get them pretty cheaply. But to find the best of the bunch, you need to add one more factor into the mix.
3. Check corporate bond yields
Because the Morgan Stanley research focuses on quality blue-chip stocks, most of the companies in the sample are corporate bond issuers too. In other words, these are firms that have tapped the debt markets for capital as well as raising equity finance. So you can compare the relative investment attractions of each.
A corporate bond yield works similarly to a dividend yield in one respect. It takes the annual return available from a corporate bond as a percentage of the current price. However, there’s one twist – because most corporate bonds have a fixed maturity date, at which the face value of the bond is returned to you (whereas shares do not), you can factor any capital gain or loss arising between now and redemption into this yield on top of any income generated. For example (and ignoring the time value of money for the sake of illustration), take a four-year bond trading at £96, offering a 5% coupon. Because all bonds redeem at their nominal value of £100, you make roughly £1 a year as a capital gain. So the total yield is around £5 (the fixed coupon) plus £1 divided by £96. That’s 5.2%.
As Secker notes, you’d normally expect the dividend yield on a share (which has the scope to offer an almost unlimited capital gain) to be lower than that on a typical corporate bond (which doesn’t – and any gain is already factored in). Yet around a fifth of stocks now offer a dividend yield above their corporate bond yield in nominal terms and more than 60% in real terms (inflation adjusted). The point? Such a stock is either a bargain (the good news) or about to cut its dividend (not so good). But Morgan Stanley reckons only four stocks on its preferred list of 60 stocks (where the gap between the two yields is over 1 percentage point) are in the latter position.
So what to buy?
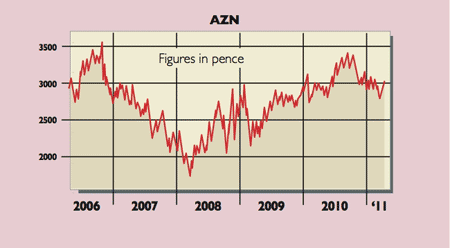
Three stocks that make the cut are pharma giant AstraZeneca (LSE: AZN), defence firm BAE Systems (LSE: BA) and water utility Severn Trent (LSE: SVT).