Stockmarkets around the world have had a great start to the year. But one key group of investors seems unconvinced: company directors in the US are dumping stocks at a record rate. These people should be in a position to understand the state of their companies better than anyone else, so it’s hardly a resounding vote of confidence in the rally. Should you follow them and sell up?
Company directors (also known as ‘insiders’) at US firms are selling nine stocks for every one they buy, according to the most recent Vickers Weekly Insiders Report from Argus Research. Over 20 years, the average is a sell rate of around 3.4 to one. Given their privileged view of the economy and their own companies, that would seem like a worrying sign for anyone buying these same shares.
As Mark Hulbert on Marketwatch.com notes, the last time the sell/buy ratio in the US climbed to the current level was in July 2011. Back then, the debate over the US debt ceiling “began to spiral out of control”, America’s credit rating was downgraded, and within a few weeks, the Dow Jones index had dropped by 2,000 points. That was no one-off, adds Hulbert.
He looked at all the occasions over the past decade when the ratio hit the current level or higher. “On average over the month following each… the broad market fell by 2.1% – as measured by the Wiltshire 5,000 total-return index.”
Why are they selling?
As the old cliché goes, “when the US sneezes, the UK catches a cold”. So what happens in the US is important for UK investors, even if we disregard the fact that British insiders seem to be selling out rapidly too (see below). But before jumping to the conclusion that you should sell right now, there are a few caveats.
Firstly, the US is quite a technology-company-heavy market. In the tech sector, it’s very common for directors to be paid in stock as much as via a conventional salary. Naturally, they want to cash in on some of this stock, especially when the market is rising. That’s because it creates some distance between the price at which they are granted stock, and the current market price, locking in a gain.
“Selling into strength”, as it is known, also means it is easier to dump large quantities of stock quickly and cheaply (there are plenty of buyers around, so bid-offer spreads tend to be narrow). Company directors in Canada, for example, which is dominated by resources stocks rather than technology, are still net buyers.
You also have to look at the reasons for selling. There may be tax bills to settle, second homes to buy, or school fees to pay. A cynic might also note that the period immediately after Christmas has the highest divorce rate – another reason why a director might suddenly need to liquidate stock.
This year there’s an added incentive – the prospect of higher tax rates in 2013 as stony-broke governments across the world try to make ends meet.
Should you follow them?
We wouldn’t base our buying and selling decisions solely around director dealing – there’s no sense in being shaken out of a stock or market you believe to be good value simply because of a broad-based indicator like this. And as Hulbert notes, the level of director sales was also high in December, and the market has yet to crash.
That said, we’d be wary of putting any extra money to work in the market, particularly the US, just now. The market has surged very rapidly, and the underlying economy still looks very weak. As Hulbert puts it: “There is a distinct possibility that this time around, unlike in December, the insiders will be right.”
Are British insiders selling up too?
At first glance, news from the UK is similarly uninspiring to the US: statistics from DirectorsDeals.com suggest that in January, £1-worth of shares was sold for every 10p-worth bought. In short, company insiders on both sides of the Atlantic seem more interested in getting out of the market than in getting back in.
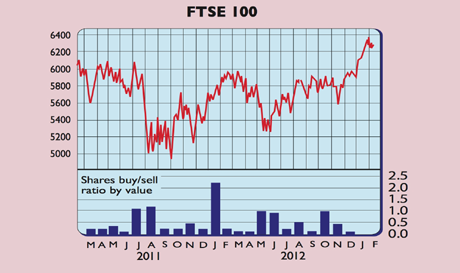
However, the data for the UK is a little less cut and dried than for the US. Although the UK buy/sell ratio for January 2012 is low at 0.1, it was at the same level in December. Indeed, it was below one for the whole of 2012, bar January (see above chart). Yet 2012 saw the FTSE 100 rise 10% and the All-Share index by 12%. So directors were selling shares despite a decent year for both indices.
Moreover, if you look at the actual number of directors trading, rather than the value of the trades, then the buy/sell ratio for January is 4.1. That’s neither extremely bearish nor extremely bullish, and suggests that there are still some optimists on UK boards.