There is “nothing bankers like more than a steepening yield curve”, says the MarketWatch blog, ‘The Tell’. But why, and what do yield curves tell investors?
Yield curves are a way of comparing the total return (yield) available on similar bonds with different maturities (repayment dates). Let’s take, say, three UK government gilts. The first is very short term and due to be bought back by the government in two years’ time. In other words, investors will get the face value of the bond back then. The second will not be bought back for ten years, and the third has 30 years to run. The yield on each of these is the total expected annual return, made up of an interest payment (a ‘coupon’ in bonds jargon), and a capital gain (or loss, depending on what price you bought the bond at).
As a very simple example, say you are looking at a 6% two-year gilt, priced at £106. In two years’ time it will be bought back by the government at face value, which is always £100. Very roughly speaking (we’ll ignore inflation), the annual yield is made up as follows. You get a fixed £6 coupon (6% of the bond’s ‘nominal value’ of £100). But when the bond matures in two years, you’ll only get £100 back, while you paid £106 for the bond. So you lose £3 a year (half of the total capital loss to maturity of £6). So this made-up bond’s yield is therefore (£6–3/106) x 100%, or 2.83%.
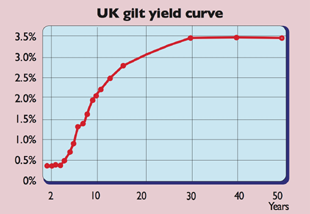
Right now the typical yield on a two-year UK gilt is more like 0.45%, on a ten-year gilt it’s just over 2% and on a 30-year gilt it’s about 3.45%. Switch to America and the equivalent figures for US Treasuries are 0.32%, 2.25% and 3.4%.If you were to plot these three points for Britain or America on a graph and connect them, you’d have an upward sloping yield curve (see chart right).
In short, the yield rises the further into the future you look. This is usually a sign of economic confidence. Indeed, the bigger the gap between the 30-year and ten-year yield, or the ten-year and two-year yield (also known as the ‘spread’), the steeper the curve and so the greater investor confidence is assumed to be.
If investors expect the economy to grow, then interest rates are also likely to rise (to stop general prices for goods and services lifting off too fast). So anyone buying a 30-year, fixed-income bond from Britain or US governments should expect a higher return in compensation (in the form of a higher yield) than someone buying a ten-year or two-year bond.
In the reverse scenario, when investors are pessimistic, you get an inverted yield curve. This is where short-term yields exceed longer-term ones. That’s because investors expect rate cuts as the economy struggles, and so will pay a premium for a bond with a decent long-term fixed income. The result – long-term gilt and Treasury prices rise and yields fall, sometimes to below the equivalent yields on shorter-dated bonds.
So why is today’s steepening yield curve good for banks? Well, banks make money by borrowing short and lending long. That means they take deposits from firms and individuals and, working on the principle that not all of these will be called in at once, use them to create longer-term loans and mortgages. So the bigger the gap between what they have to pay to savers, and what they can charge to lend over longer periods, the better.
But there’s a nasty twist here – the more economic confidence builds, the greater the chances that stimulus measures such as money printing (quantitative easing) and the various cheap money programmes, such as Britain’s Funding for Lending scheme, will be withdrawn or reversed. In their current fragile state, that could be bad news for banks. That’s why we don’t fancy the idea of piling into the sector now, even as the yield curve steepens.