“Buy on the sound of cannons”, financier Nathan Rothschild supposedly said in 1815. A Deutsche Bank study suggests he was right.
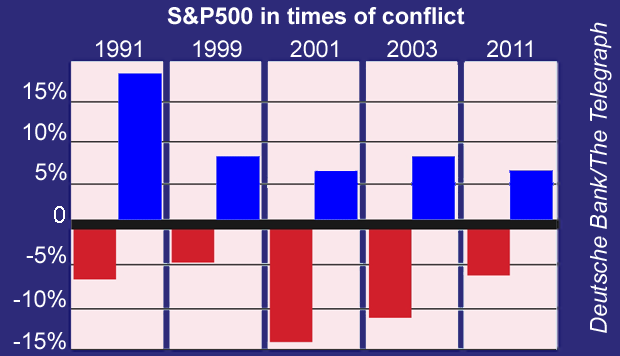
It looked at 12 conflicts, including both Iraq wars (1991 and 2003); NATO’s bombing of Serbia in 1999; action against Afghanistan in 2001; and 2011’s strikes on Libya (see chart). In each case, the S&P 500 slipped from the high point of the three months before strikes began (red bars). But it had rallied by an average of 7% a month after military action started (blue bars).
The results should be taken with a pinch of salt. There are always several influences on stock prices. But the pattern is largely due to gradually increasing visibility, says Mark Luschini of Janney Montgomery.
When investors are “in the dark” about when action might start and what the ramifications may be, they are fearful. Once it’s underway, it gets easier to “quantify” how the situation might shape up, and “price it in” accordingly.