You might think that the global economy would have worked off some debt a few years after a debt crisis. But you’d be wrong. Almost eight years after the credit crunch began, the world’s debt pile is higher than ever – and odds are we won’t make much of a dent in it over the next few years. High debt levels undermine growth and make households and governments more vulnerable to financial crises. So little has changed since 2007.
Between the end of 2007 and July 2014, the world added $57trn to its borrowings, according to McKinsey Global Institute. The consultancy has totted up public, household, financial sector, and corporate debt (for companies outside the financial sector). Overall, debt is now $199trn, or 286% of global GDP. That’s up from 269% in 2007.
“Some of the growth in global debt is benign or even desirable,” says McKinsey. For example, developing economies accounted for almost half the increase. This is partly a reflection of financial markets evolving and more households and firms gaining access to credit. If you strip out the borrowings of banks and other financial institutions, then overall emerging-market debt comes to 121% of GDP – “relatively modest” compared to the 280% seen in advanced economies. Malaysia, Thailand and China are notable exceptions.
Where the debt is piling up
If you exclude the financial sector, not a single advanced economy has managed to cut its debts since 2007. Non-financial corporations have only added a bit of leverage in recent years. But in many cases public debt has jumped, offsetting any fall in household debts as governments bailed out banks or spent money to prop up tanking economies.
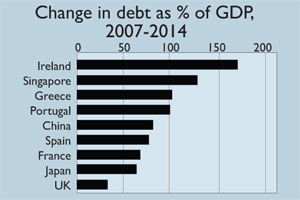
In Ireland, for instance, households have reduced their debt-to-income ratio from 225% to around 175% since 2007. But public debt has surged. And overall, Ireland tops the table for the biggest jump in public, private and corporate debt since 2007: rising by 172 percentage points of GDP. In advanced economies as a whole, public-sector debt has exploded from an average 69% of GDP to 104%. This has offset minuscule progress on private debts, which have inched down from 158% to 156% of GDP.
The scant progress is partly due to many households continuing to borrow and spend. In America and Ireland, household borrowing rose by more than a third in the run-up to the crisis. Since then, consumers in both states have cut back, as have those in the UK and Spain. But in France, South Korea, Sweden and Australia, the debt-to-income ratio has climbed by 10%-19% since 2007. In Canada it is 22% higher. Denmark has the highest debt-to-income ratio, at 269%. This is largely down to rising mortgage debt, as rising house prices encourage borrowing and spending.
Who’s vulnerable?
So which countries look most vulnerable to a housing and consumption downturn? To find out, McKinsey has assessed the debt-servicing ratio – debt repayments as a percentage of income – and recent trends in house prices. It has also taken into account the overall debt-to-income ratio and how it has changed in recent years, to estimate the sustainability of household debt. It reckons those countries vulnerable to major housing busts are Australia, Canada, Malaysia, South Korea, the Netherlands, Sweden and Thailand.
The key to reducing debt of all kinds is economic growth, but this is getting harder and harder to come by. Workforces are shrinking in most developed countries. Everyone is trying to cut back at the same time, so it’s hard to secure an advantage by weakening your currency to boost exports. Global growth is soggy, so inflation, which erodes the real value of debt, is low. And how will fragile, debt-soaked Western economies cope with higher interest rates or a new financial crisis? It’s clear that we are still firmly in the grip of the post-bubble hangover.