The past 15 years have been a highly eventful time, with plenty of lessons for investors to learn – or in many cases, to relearn. Here are some of the most important developments.
Interest rates can be negative
At the height of the global financial crisis in late 2008, panic-stricken investors were willing to buy short-term US Treasury bills at prices that gave them a negative yield to maturity (in other words, they were guaranteed to lose a small amount) in return for the confidence that the rest of their capital would be returned to them safely. That seemed ground-breaking at the time, but it was nothing compared to what’s happened since.
As the eurozone crisis deepened, European governments were able to sell even longer-dated bonds on the same terms: in April, Switzerland sold a ten-year bond with a negative yield to maturity. Today, even Italy can sell short-term debt with a negative yield.
Even more remarkably, European central banks have introduced negative rates on excess deposits – ie, banks have to pay the central bank to park money with it – to try to boost lending (the European Central Bank) and to weaken their currencies (Denmark, Sweden, Switzerland).
Policymakers don’t have a plan
Fifteen years ago, faith in central bankers and politicians was at an all-time high. Federal Reserve chairman Alan Greenspan was the “maestro” who presided over America’s prosperity; Gordon Brown claimed to have abolished “boom and bust”. Subsequent events should have disabused everybody of the notion that policymakers have a coherent, well-thought out plan for dealing with whatever problems we face.
As the farcical efforts to contain the subprime crisis demonstrated, much of the time they don’t even recognise there is a problem until too late, let alone know what should be done. Yet many investors retain a misguided faith in the authorities, as shown by the way they hung onto the words of Europe’s policymakers during the Greek debt crisis.
Stocks can yield more than bonds
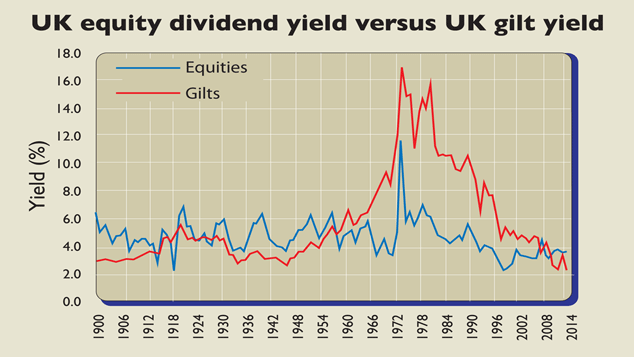
Here’s a bit of financial history that almost nobody seems to remember: until the middle of the last century, US stocks consistently had higher yields than government bonds. The same was also generally true in the UK, as the chart to the left shows. In 1958, that changed and dividend yields fell below bond yields on a sustained basis.
Investors at the time saw this shift as an anomaly and expected the old relationship to reassert itself. A mere 50 years later, at the height of the crisis, it finally did.
Today, UK stocks clearly yield more than gilts, as do US ones once cash returned to shareholders through buybacks is taken into account (American companies increasingly favour buybacks over dividends). So while ultra-low bond yields mean that stocks now seem comparatively good value, it’s worth bearing in mind that the relationship between them isn’t as fixed as many investors believe.
Innovators often lose money
Investors have had several reminders that technological breakthroughs often don’t mean big profits. The internet has exceeded almost all the expectations we had in 2000, but the majority of dotcom darlings were a disaster for investors. Technologies such as solar power have made huge progress: global installed solar capacity has risen from around 1GW
in 2000 to around 200GW now.
Yet solar-panel producers have been terrible investments, due to a rush of new entrants and relentless deflation in panel prices. In short, while hot stories such as these frequently offer good short-term trading opportunities, it rarely pays to be a long-term investor in early movers. Better to wait until the market matures and you can see who might make money.
Ingenuity trumps scarcity
While it may not pay to bet on innovation, it’s often a bad idea to bet against it as well. Shale gas and oil has been an outstanding example of this.
In 2000, American energy production was in long-term decline. Nobody would have predicted the surge in output made possible by new hydraulic fracturing technology (fracking).
How long this will last remains to be seen – shale oil and gas fields tapped by fracking are likely to be exhausted sooner than conventional ones – and talk of America achieving “energy independence” may be overdone. But the result has been a collapse in energy prices, delivering an enormous boost to the US economy and hurting oil producers and countries that depend on energy exports.
Decoupling is a myth
There were many variations on the theme of “decoupling” before the crisis. Subprime wouldn’t affect the wider US economy, Europe could continue growing through an American recession, and – most famously – emerging markets would do fine regardless of what happened in the developed world. All of these theories proved wrong, illustrating how tightly interconnected the global economy and markets are.
Ironically, the strongest example of decoupling we’ve seen has been America – the home of the global financial crisis – staging a stronger recovery and a better stockmarket performance than most of the rest of the world in the last few years.
Hedge-fund alpha is leveraged beta
Hedge funds were the new investment religion of the early 2000s, promising better returns (“alpha”, in the jargon) with lower risk (“beta”) than the wider market. Total assets managed by hedge funds rose from $236bn in 2000 to $2.1trn by the end of 2007. Yet in hindsight, it’s clear that their success was due less to genius and more to betting with leverage (borrowed money) in favourable markets.
So from end-2000 to end-2007, the HFRI Equity index of equity hedge fund strategies returned 75%, compared to 26% for the S&P 500 (with dividends reinvested).
But in the trickier conditions we’ve seen from end-2007 to now, the S&P 500 has returned 55%, compared to 13% for the HFRI Equity index. Nonetheless, after a few tough years, hedge-fund assets are rising sharply again (passing $2.7trn this year), suggesting that many investors haven’t learned this lesson.
Don’t trust the experts
The credit-ratings agencies – Moody’s, Standard & Poor’s and Fitch – played a major role in enabling the subprime crisis, through their willingness to stick AAA ratings on subprime-mortgage collateralised debt obligations (CDOs). Briefly, these were bundles of US subprime mortgages that had been structured in a way that supposedly turned the highly risky underlying loans into safe investments.
Investors trusted the ratings agencies’ verdicts – after all, they were supposed to be better at rating these risks than anybody else – and piled in, attracted by the high yields on offer. But the agencies’ assumptions and models were flawed, the CDOs were much riskier than believed, and investors in them lost hundreds of billions of dollars.
The biggest bankruptcies in history
The last 15 years have been a spectacular era for corporate failures, as the table below of the ten largest bankruptcies in history shows. Unsurprisingly, many happened during the peak of the 2008-2009 crisis, but there were also a number of other high-profile unrelated incidents, such as that of US broker MF Global, which collapsed after making large bets on eurozone bonds. All but one involved US-based companies.
Europe’s largest bankruptcy, the €14.3bn (then $18bn) collapse of Italian dairy company Parmalat in 2003, would not even make the American top 20. The list only includes companies that have entered formal bankruptcy proceedings: the many financial firms bailed out by governments in 2008-2009 are not included.
| Company | Country | Date | Sector | Assets |
|---|---|---|---|---|
| Lehman Brothers | USA | 2008 | Investment bank | $691bn |
| Washington Mutual | USA | 2008 | Bank | $328bn |
| WorldCom | USA | 2002 | Telecommunications | $104bn |
| General Motors | USA | 2009 | Carmaker | $91bn |
| CIT | USA | 2009 | Business finance and leasing | $80bn |
| Enron | USA | 2001 | Energy trading | $66bn |
| Conseco | USA | 2002 | Insurance | $61bn |
| Kyoei Life Insurance | Japan | 2000 | Insurance | ¥4.53trn (then $42bn) |
| Energy Future | USA | 2014 | Electric utility | $41bn |
| MF Global | USA | 2011 | Brokerage | $41bn |