Starting valuations determine your long-term returns. Investors in US stocks “currently face some of the worst returns in history”, says Jesse Felder on TheFelderReport.com. The cyclically adjusted price-earnings ratio of the S&P 500 is now 29, the third-highest reading after the bubbles of 2000 and 1929.
The average since the 1880s has been 17. There are plenty of other signs of froth on Wall Street, as MoneyWeek contributor Time Price notes in his Price Value Partners report. A valuation of $28bn for Snapchat, a profitless web business, recalls the dotcom era.
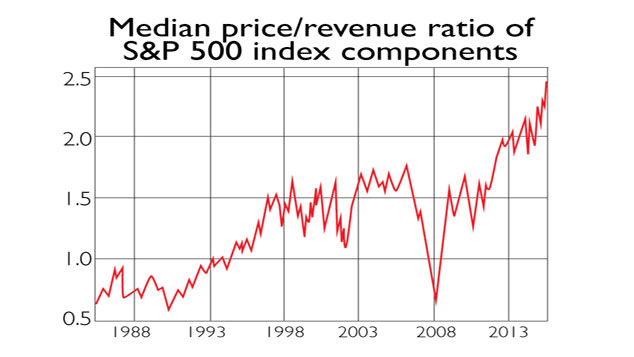
Broader indicators also suggest the US is absurdly overpriced. John Hussman on HussmanFunds.com notes that the median price/sales ratio in the S&P 500 has shot up to a record 2.5. This is “the most broadly overvalued moment in market history”. In the dotcom era, a few large-caps skewed the picture. Meanwhile, the US ratio of stockmarket capitalisation to national income is around 1.3. It has only been higher for a few months during the dotcom mania.
Europe is certainly enticing compared with America, though it is not at bargain-basement levels compared with its own history. The wider UK, Spanish and French markets are on price-earnings (p/e) ratios of around 21, while Germany’s is only slightly lower at 18.7, according to figures from Capital Economics. Europe’s book value is far below Wall Street’s. Japan is the only market whose p/e, 18.2, is currently below its ten-year average. What’s more, as we noted last week, 40% of its equities are trading below book value. It is the only major market left that can be considered cheap.