I’m just back in the office after a couple of weeks in France. (It was very nice, thank you – hope you’ve either managed to get away this summer or are planning to.)
Let’s have a quick catch-up on the charts. Gold had an interesting week last week. The Federal Reserve’s latest minutes were more dovish than expected (markets really never learn – it’s very hard to lose money by betting on the Fed being more dovish than expected).
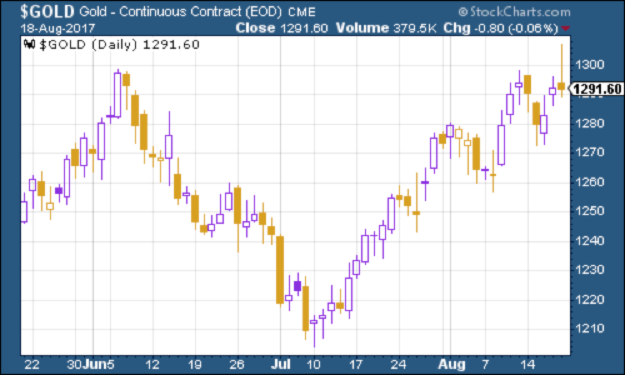
As a result, gold spiked up to above $1,300 an ounce towards the end of the week. That got gold investors rather excited as it meant gold had punched up through the $1,295 level, which has proved stubbornly difficult to break through.
However, it then fell back and ended the day below that price. That is something that tends to make chartists rather jittery. So it’s possible that gold needs to fall back again before it can make another run at the $1,300 level.
Then again, if the Fed is more dovish than expected again when Janet Yellen speaks at the Jackson Hole conference on Friday (that’s where central bankers have their summer get together), then gold could be making a break for it again sooner than we might think.
(Gold: three months)
Second, the US dollar index has been hovering around the same level as last time. Again, markets are unsure of whether they want to swim for “safe havens”, or to get back into the deeper water. The dollar benefits a bit from safe haven demand, but it’s also behind the strength in the yen.
There is certainly a sense of foreboding in the markets at the moment, and with the state of geopolitics, it’s no wonder. The S&P 500 is showing some signs of wobbling, and there seems to be a growing view that markets are too expensive given where we are.
Will this be crystallised in the autumn, which is often the point at which markets have cracked in the past (albeit, that’s using a very small sample size)? We’ll soon see.
(DXY: three months)
On 10-year US Treasury bonds – the ten-year yield was little changed overall last week, as investors remained wary.
(10-year US Treasury: three months)
Copper’s good run continued. This – I think – is partly down to hopes for Chinese growth continuing; partly because copper is showing obvious signs of “breaking out” technically; and partly because of electric car mania driving up the prices of less sexy metals than lithium.
(Copper: three months)
Bitcoin – well, what can I say? Another staggering week for the cryptocurrency. It’s up to over $4,000 a coin – more than two ounces of gold now.
I’ll be honest – I still struggle to wrap my head around bitcoin and its fellow cryptocurrencies. As a natural sceptic, I’m inclined to think that this is a massive bubble. But as my colleague Dominic pointed out last week, bubbles do change the world. I’m just wondering exactly what the decentralised ledger is going to do for us.
In the meantime, the whole cryptocurrency thing does remind me a bit of stories about the South Sea Bubble – lots of exciting plans being bandied about by enthusiastic amateurs and outright scam merchants.
What’s interesting is that pretty much none of those schemes came to fruition, even although many did point to far-future technologies that in the long run, did become significant.
Instead, the South Sea bubble ended up being more about the evolution and expansion of knowledge of finance and capital markets than anything else. Maybe bitcoin will do the same, but specifically for money?
The weekly US jobless claims data continued to stay strong. According to David Rosenberg of Gluskin Sheff, when this hits a “cyclical trough” (as measured by the four-week moving average), a stock market peak is not far behind (on average 14 weeks), and a recession follows about a year later.
This week, US jobless claims came in at 232,000. The four-week moving average edged lower to 240,500. However, so far its lowest level of the year remains the low it hit on 20 May.
If that holds as the cyclical trough, then if Rosenberg is right (and to be fair, it’s a small data set) we might be looking at a stock market peak this month (which would look pretty prescient!).
That said, with jobless claims falling so sharply last week, I wouldn’t yet want to bet against another low being made this year.
Chart number seven is the oil price (as measured by Brent crude, the international/European benchmark). Oil has strengthened this week.
(Brent: three months)
Finally there’s Amazon. The tech sector giant tried to rally along with the rest of the market last week, but slipped back to roughly where it started. Has Amazon peaked for this particular cycle? It’s too early to say of course, but it’s worth watching for signs as to whether this is just a blip, or a bigger correction, or the start of something even more significant.
(Amazon: three months)