Stockmarkets have been a little bit shaky these last few weeks. You might have noticed.
What’s causing the jitters?
The high valuations? The spectre of higher rates? The growing . political unrest? Maybe after eight years of gains, the bull market is just tired?
Or is it the fact that this is the second half of a year ending in seven?
Today, we head into the dubious world of numerology
1907, 1987, 1997, 2007… hmm, have you noticed something? You might have heard the rumour. Years ending in seven are bad for the stockmarket – from the panic of 1907 to the beginning of the Great Financial Crisis in 2007, from the crash of 87 to the Asian crisis of 97.
Just coincidence, surely? Or is there some truth to this ending-in-seven business?
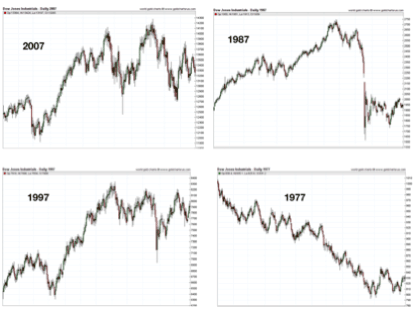
Let’s start with 2007. Remember that? Markets peaked in July and then there was a nasty summer sell-off. I still vividly recall a piece by James Harding in The Times, which described Lords as gripped by a “communal sense of the jitters”.
But then the market rallied. The highs were re-tested in the autumn, before the sell-off, which would turn into the crash of 2008, began.
Overall, in the Dow Jones index, the drawdown – the gap from peak to trough – was only 10%, and 2007 ended in the black. But, nonetheless, it was the year the market peaked.
We go back to 1997. The Dow actually ended the year up by more than 10%. It was pretty much business as usual. However, there was the small matter of the Asian crisis in the second half of the year, and a nasty 17% sell-off.
So to 1987, the Daddy, the one we all know about. But the Dow actually ended 1987 in the black by a few points, believe it or not, despite the historic October crash, which saw a 40% drawdown.
1977 was a horrible year in a cyclical bear market. The decline was around 10%. From peak to trough it was more like 15%.
Here, courtesy of Nick Laird at goldchartsrus.com, are the charts for the period:
Moving back in time, 1967 was a positive year, albeit with a 12% drawdown in the final quarter.
1957 was horrible, pretty much straight down from July for a 13% decline, while 1947 was flat and no major sell-offs to speak off. 7% was the drawdown.
If it wasn’t for 1929, stockmarket historians would speak of 1937 with horror. It was a bear market, which saw a 30% decline and a 1987-level, 40% drawdown.
Here are the charts:
We move further back in time. 1927 was a good year – the market ended up 20%.
1917 was a stinker. The market ended the year 22% down, though at one stage the peak-to-trough falls measured over 30%.
1907 was even worse – a 24% decline, and a 35% drawdown. October was known as the “Panic of 1907” or – and I love this – the “Knickerbocker crisis” (Knickerbocker was the second largest trust in the US, and when it was forced to suspend, a bank run was triggered). From its high the previous year the drawdown on the Dow was 50%. JPMorgan had to pretty much bail out the baking system.
And, finally, we have 1897, which was a good year overall.
Here are the charts – and, let me ask you, how often do you get to see a chart of the Dow in 1897? Full kudos to chart hero and Lord of Data, Nick Laird.
So, all in all, I’d say years ending in seven seem mostly rotten, but not conclusively so. There are enough exceptions – 1897, 1927, 1967, 1997 (almost every 30 years?) – to flaw the theory.
And so far 2017 is bucking the trend, if there is one. The Dow began the year at 19,900 and has climbed fairly steadily to reach an all time high of 22,200 a fortnight ago.
A very peculiar coincidence – or something more sinister? However, this is why I bring this subject of years ending in seven up now. In a recent blog post, Dana Lyons, partner at J. Lyons Fund Management in the US, has run some numbers, which indicate that it is actually the second half of years ending in seven – ie from now on – that are particularly bad.
Average (median) returns for the first half of years ending in seven since the year 1907 are actually pretty good, Lyons found – up 3%-4%. However, he notes that “at -9.29%, the 2nd half of ‘7’ years has the worst median return of all half years”.
Here is his chart, which illustrates his findings:
The numbers are even uglier for drawdowns. The average drawdown for the second half of in a year ending in seven is 20%.
An average drawdown would make for a Dow target of 17,760, based on the high of 22,200 earlier this month, which is a fairly sizable drop from here.
Could we be in for a sticky few months? Do we sell everything and go massively short? Or take a more measured, long-term view?
Valuations are high, sentiment is jittery. And for reasons unknown to me, October seems to be the stockmarket crash’s favourite month – that’s when many of the biggest crashes seem to happen. It’s certainly quite easy to make the case for declines.
But a decline because this is the second half of a year ending in seven? Hmm. I’m not so sure. Despite the compelling coincidence, I’m not selling anything. That said, I do have a small short position in my speculative account, just in case “H2 7 doom” does manifest itself.
Then I can go, “I told you so”.