This article is taken from our FREE daily investment email Money Morning.
Every day, MoneyWeek’s executive editor John Stepek and guest contributors explain how current economic and political developments are affecting the markets and your wealth, and give you pointers on how you can profit.
In this week’s issue of MoneyWeek magazine
●
The Pacific Alliance: the four best bets in Latin America
●
Where to find Japan’s small, cash-rich bargain stocks
●
It’s too soon to sell out of tech stocks
●
A big trim for master-trust pension schemes
●
Three top-notch small European companies going cheap
● Share tips of the week
Not a subscriber? Sign up here
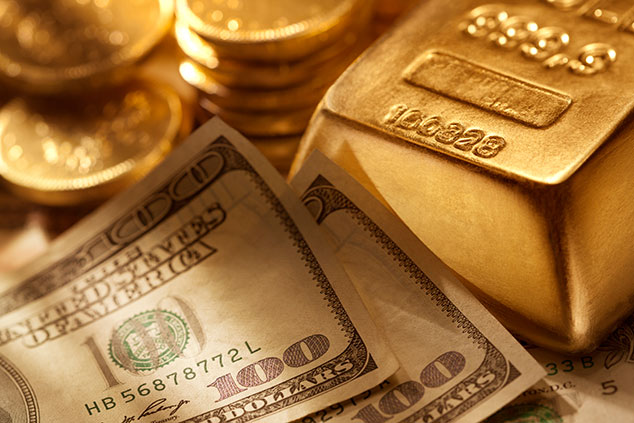
Twice over the summer we have posited that there is an opportunity setting up in gold.
Not that this is the beginning of some great new bull market; just that there is a potential trade on – buy now and offload later in the autumn or winter, ideally at a price 10% or 20% higher.
Gold “has been so bad it’s starting to look good” was the general argument (bullion dealer Ross Norman’s phrase, not mine).
Today, at risk of banging my head against a wall, I make the same argument again.
Gold is heavily out of favour right now – which is a very bullish sign
When we“has been so bad it’s starting to look good” the price was $1,204 per ounce. Today, as I write, we sit at $1,208. Very little going on, apparently.
What those two numbers don’t tell you is that in the interim, gold plunged some $40 to $1,160, bringing tears to the eyes of anyone using leverage, before rebounding back.
It’s been horrible. But there are many reasons to consider a punt now.
On the futures exchanges – the COMEX – the action is very telling. There is as little open interest as there has been since late 2015, early 2016, which is when gold went off on a major rally. That’s because when there is little commitment, as is the case now, it means there is a lot of room for new buying to come into the market.
Meanwhile, the commercial hedgers, who are normally net short, now have their largest net long position of all time. These guys are known as the “smart money”, and it (sometimes) pays to monitor what they’re doing. For them to be net long is almost unheard of – normally it’s a question of not if they’re short, but how short.
The situation is even more extreme in silver.
Meanwhile, lease rates are also tightening. What that means is that it has become more expensive to borrow gold (which suggests a diminishing supply). A year ago it was 0.65% – today it is above that. It’s nothing like the 3% witnessed in 2008, as Ross Norman points out, but it is still indicative of a market that is tightening.
Silver, meanwhile, is at 0.75% and platinum (which has been very strong this last fortnight, albeit from oversold levels) is at 1%.
Then there’s the seasonality. Summer is usually the best time to get long (yes, I know it’s a stretch to call 21 September “summer”).
On top of that, GLD – the most traded gold exchange-traded fund in the world – is now seeing extraordinarily low inventory levels (not seen since late 2015-16). Again means that there are few longs in this market – and a lot of room for more. The 700 tonnes excess of inventory that was dulling possibilities in June-July has now gone.
Meanwhile, physical dealers are despondent – which is contrarian bullish in itself.
So, in short, there are a lot of dominoes lined up.
What really matters for gold’s next big move
However, when it comes down to it, there one price that matters. If you want to know where gold is going over the next three or six months, then all you need to do is tell me where the US dollar is going.
If the US dollar is going up, then gold won’t be. Yes, there are times when gold and the US dollar rise together, but these tend to be the exception, not the rule. So let’s take a look at the dollar and see if we can divine anything.
This is the US dollar Index, which measures the dollar against the currencies of the US’s major trading partners, since late 2016.
You can see, first, the fact the dollar peaked almost at the moment Donald Trump was elected president. He promised a weaker dollar and, whether by design or chance, this promise was delivered.
The dollar went from 103 to 88 – that’s a fairly mammoth move in the forex scheme of things – before the selling exhausted in the winter of this year. We got a triple bottom as if to emphasise the fact that the selling was done.
Then came a rally that rather took everyone by surprise. Everything anti-dollar – from emerging markets to industrial metals – took a big hit.
However, in mid-August, at the same time as gold dipped to $1,160, we got what appears to have been a mini-blow-off top in the dollar. Since then, the trend over the last five or six weeks has been down, quite markedly so. The selling has been strong.
The red dotted line in the chart above is a possible line of support, but I wouldn’t bet on it holding.
To me, this looks like a market whose short-term trend is set to continue: it wants to head lower, in other words. If it does, the anti-dollar trade is back on. Emerging markets can breathe a sigh of relief. Miners can breathe a sigh of relief as marginal projects become viable once again.
And, of relevance here, gold and silver bugs can breathe a sigh or relief too.
This one is all about the US dollar, folks. Where that goes, the rest will follow.
All I’d say is this: given the dollar’s recent weakness, I’d like to have seen a bit more strength in gold and silver. That concerns me.
One can only assume they are “building cause”.