Welcome back. We have another freshly baked podcast this week (three weeks in a row now – this may be a trend…) – Merryn and I talk about inflation, Amazon, oil prices, Italy and lots more, all in just 15 minutes (seven and a half if you run it on double speed).
If you missed any of this week’s Money Mornings, here are the links you need.
Monday: When will the slow-burning crisis in Italy ignite?
Tuesday: Markets are cyclical – but how can you tell where we are in the cycle?
Wednesday: Silver and platinum are both very cheap – how long can that last?
Thursday: Rising US bond yields could spell the end of an era
Friday: Why you should be glad that house prices are falling in “real” terms
And don’t miss this week’s issue of MoneyWeek magazine – if you’re not already a subscriber, sign up here now.
And now over to the charts.
The US non-farm payrolls data came out yesterday, and they were an interesting mixed bag. The headline figure was disappointing, in that the US economy added fewer jobs than expected. But the underlying story was one of ongoing strength.
The unemployment rate dived to 3.7% – the lowest since 1969. Wages rose at a 2.8% annual rate – as expected by Wall Street, but a decent clip, and looking like getting faster. Moreover, the number of jobs added in July and August were revised substantially higher. So overall, it was pretty upbeat.
That points to more inflationary pressure in the US, more pressure on the Federal Reserve to raise interest rates – and it also suggests we’ll see bond prices continue to fall and Rising US bond yields could spell the end of an era.
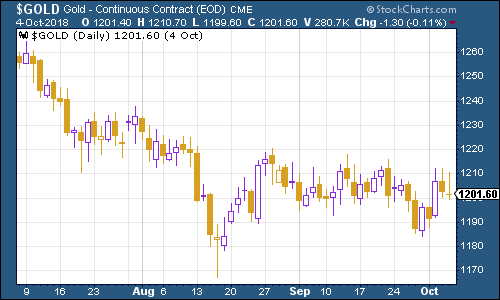
Gold (measured in dollar terms) continued to struggle. Yet, given the rise in the US dollar and bond yields this week, the real surprise perhaps is that gold managed to stay its ground. In some ways it shows just how negative sentiment has become. As Dominic pointed out earlier this week, it’s Silver and platinum are both very cheap – how long can that last? the scene for a decent precious metals rally. We’ll see.
(Gold: three months)
The US dollar index – a measure of the strength of the dollar against a basket of the currencies of its major trading partners – continued to rebound this week amid rising excitement over the strength of the US economy.
(DXY: three months)
The yield on the ten-year US Treasury bond was the biggest mover this week. It’s now at its highest level since 2011. It’ll be interesting to see how far it can go before something breaks.
(Ten-year US Treasury yield: three months)
The Japanese government bond (JGB) yield also moved significantly higher (for Japan at least). It rose above 0.15% for the first time since the Japanese central bank decided to relax the band it allows the bond yield to trade in.
(Ten-year Japanese government bond yield: three months)
The yield on the ten-year German bund (the borrowing cost of Germany’s government, Europe’s “risk-free” rate) had been sliding When will the slow-burning crisis in Italy ignite? shock (investors bought German bonds and sold Italian ones) but it rebounded higher along with other global bond yields as the US took off.
(Ten-year bund yield: three months)
Copper had a less exciting week, roaming around the $2.80 per pound mark.
(Copper: three months)
Cryptocurrency bitcoin continued its remarkably non-volatile streak. Is it growing up? Or has everyone involved in it just decided to buy and hodl? We’ll see.
(Bitcoin: three months)
On US employment, the four-week moving average of weekly US jobless claims stayed close to its cycle low this week, coming in at 207,000. Meanwhile weekly claims also came in at 207,000.
As David Rosenberg of Gluskin Sheff has noted in the past, the stockmarket usually does not hit its peak until after we’ve seen jobless claims (as measured by the 14-week moving average) hit rock bottom for a cycle.
In other words, jobless claims hitting a cyclical trough and then starting to turn up is a lead indicator for a stockmarket peak. Based on a very small number of widely varied observations, the stockmarket peak usually follows about 14 weeks from when jobless claims hit the bottom, and a recession follows about a year later.
In other words, we should be a while away from a peak and recession as yet. But watch out for any sustained rise in the number of jobless claims.
(US jobless claims, four-week moving average: since January 2016)
The oil price (as measured by Brent crude, the international/European benchmark) has surged higher this week, partly due to concerns that with Iran cut off from global markets, there’s just not going to be enough oil to go around.
(Brent crude oil: three months)
Internet giant Amazon made headlines this week with its decision to raise its minimum wage. Merryn and I discussed why this probably isn’t being done out of the goodness of Jeff Bezos’ heart on the podcast. Suffice to say, it looks like a smart competitive move, although Amazon did decline with the rest of the tech sector this week as bond yields picked up.
(Amazon: three months)
Electric car group Tesla continues to be a sideshow to the ongoing egotistical meltdown of its chief executive Elon Musk. No sooner had he settled with the US regulator, the SEC, over his careless “I’m taking Tesla private” tweets, than he was back tweeting again, insulting the regulator outright.
Naturally, the shares have fallen. I am struggling to see how big investors in the company can tolerate Musk at the helm for much longer, regardless of how integral he’s deemed to be to the brand.
(Tesla: three months)
Have a great weekend. And don’t forget to another freshly baked podcast .