We have a new podcast this week – I make a ridiculously specific and ill-advised prediction about the stockmarket (the golden rule of financial commentary is to never give a forecast alongside a timeframe); while Merryn talks about a fascinating conference on longevity and what the implications are for everything from retirement to housing (let’s just say, I hope you get along with your mother-in-law).
And if you missed any of this week’s Money Mornings, here are the links you need.
Monday: Why the strong US jobs data could be bad news for investors
Tuesday: The US vote doesn’t matter – what matters is which story markets choose to believe
Wednesday: The pound is very, very cheap – but it’ll stay that way until Brexit is sorted
Thursday: Markets like gridlock – but they shouldn’t take it for granted
Friday: Is China’s massive bear market a buying opportunity?
Don’t miss Merryn’s piece on how changes to the Help-to-Buy scheme are going to make the housing market even wobblier than it is now – and also create problems for recent entrants to the property market. And speaking of dodgy get-rich-quick schemes, Merryn also looks at how to avoid being taken in by scam merchants and cold callers.
Lastly, don’t miss this week’s issue of MoneyWeek magazine – if you’re not already a subscriber, sign up here now.
This is the point where we normally go over to the various charts that we keep an eye on, but this week I want to focus on one specific area – oil prices.
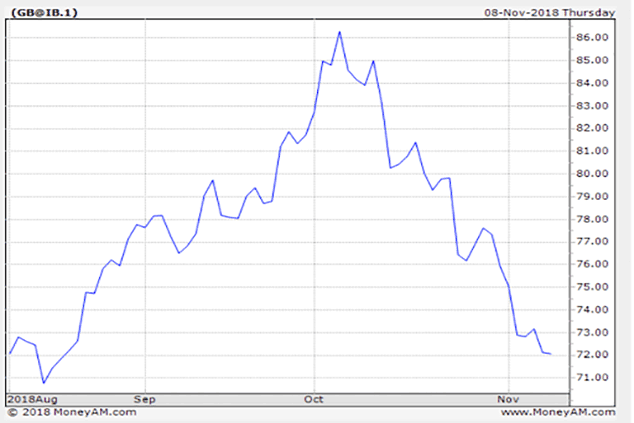
October was a tough month for many asset prices, but oil has had a particularly torrid time. You can see that from the chart below (and you can look at the live version on the MoneyWeek website).
(Brent crude oil: three months)
At the start of the month, the oil price (as measured by Brent crude rather than West Texas Intermediate, the US benchmark, although WTI has tanked as well) was surging to its highest levels since the big crash in 2014. Now, it’s back down to where it was in August. In fact, oil is now in a bear market (as measured by the traditional 20% drop).
What’s happened? How on earth did the supply and demand outlook change so drastically in less than three months?
Let’s dig into this a bit.
The big geopolitical shift is pretty clear. When sanctions were re-imposed on Iran by the US, it looked as though Iranian oil supplies could be swept off the market entirely. That helped drive oil prices higher.
However, the US relented somewhat and has allowed eight countries to continue getting supplies from the country. Apparently, Iran has been able to sell as much oil as it wants. This is understandable. Donald Trump may have twigged that there are few things the US populace likes less than seeing the cost of petrol go up.
Meanwhile, we’ve also seen US production rise faster than expected, while both Saudi Arabia and Russia – who had agreed to limit production quite some time ago – have boosted production too (partly under pre-mid-term duress from Trump).
So we’ve gone from a situation where everyone was worried that there wouldn’t be enough oil, back to a situation where supplies look plentiful, or sufficient at least.
Will that last? Perhaps not. Oil ministers are meeting this weekend in Abu Dhabi to talk about production policy, and we’ll see what they come out with. Meanwhile, Venezuelan production is still cratering, and there’s no guarantee that the US will continue to allow Iranian exports at these levels.
Certainly, the oil price looks as though it is due a bounce. And I suspect that any drop in the oil price will probably be cut short by a producer getting cold feet and reining in supply again. Unless Venezuela somehow comes back online (which is a long time away) or Iran gets back in America’s good books.
In other words, not a terribly exciting prediction, but I reckon oil will probably bounce around in a wide range around this sort of level for the next while. It’ll probably get vertigo when it’s in the $80s and it’ll get keen to bounce if it falls much below $60.
What is the impact on the big picture? The first thing you think of with oil prices is inflation. But the tricky thing here though is that oil is something of a double-edged sword when it comes to inflation. When it goes up, it drives inflation higher in the short term because it pushes costs up, both for businesses and individuals. In fact, US producer price inflation has just hit its highest level since 2012 – rising at a rate of 2.9% a year.
But in the longer term, you can argue that a soaring oil price is disinflationary – because a high oil price is basically a tax on consumption. It robs individuals of a bigger chunk of their disposable income, which means potential demand gets diverted from the high street and into the back pockets of oil producers.
So all in all, the typical Western economy – which is more dependent on consumption than on oil production – prefers lower oil prices rather than higher ones.
This in turn means that while the recent slide in prices may take some of the urgency out of short-term inflation statistics – and thus help the market to relax a bit about the pace of rate rises – in the medium term it will make the economy even more overheated.
As far as the impact on oil stocks goes – assuming the oil price fluctuates in this range for the foreseeable future, I would think that you’re safe to carry on owning oil companies. Just note that if you’re a sterling investor, it’s probably worth paying at least as much attention to the effect of the weak pound – depending on what happens with Brexit, that may or may not last.