Welcome back. Merryn and I recorded a brand new MoneyWeek podcast this week, in which we discuss customs unions; snooping technology in your car; the EU’s habit of passing dull-sounding rules with significant consequences that we never get a chance to have a proper public debate on; and we also reveal the one political and economic point on which we and Jeremy Corbyn are in full agreement.
Have a listen here.
I’ve also had a couple of very nice reviews for my book, The Sceptical Investor, over the last week or so. And in the name of shameless self-promotion, I’m going to direct you to them right now.
Paul Rodriguez of ThinkTrading.com called it: “an excellent book, packed with thought provoking advice and practical guidance that reveals a genuine desire to assist the reader.” Meanwhile, Richard Gill in Master Investor magazine describes it as “a comprehensive manifesto for contrarian investing.”
If you haven’t yet bought your copy, get your 25% discount right here. (And if you have already read it, then please do leave your own review on the Amazon page if you have the time).
If you missed any Money Mornings this week, catch up below.
Monday: Brace yourself – the global economy might be healthier than it looks
Tuesday: Are active fund managers doomed?
Wednesday: Palladium’s rise has been epic – will platinum ever catch up?
Thursday: Italy: one big threat to strike off your worry list for 2019
Friday: Is Saga’s massive profit warning a buying opportunity?
And if you don’t already subscribe to MoneyWeek, do it now – you get your first six issues free when you sign up.
In contrast to all the talk of yield curve fears, this ended up being a bit of a “risk-on” week. One reason was that both Chinese and US manufacturing data were better than expected. A second reason was that we heard new rumours that China and the US are on the verge of a trade deal. And a third reason, was that US jobs data was a bit better than hoped, even if wages weren’t.
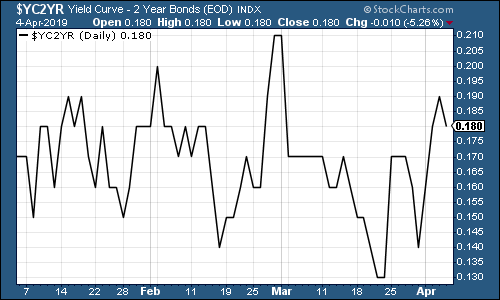
So what’s that done to the yield curve (here’s a reminder of what it is) this week? Well, the section of the curve that we watch has rebounded pretty neatly (and the section that did invert last week – the spread between the three-month and 10-year bonds – had uninverted by the end of this week).
The chart below shows the difference (the “spread”) between what it costs the US government to borrow money over ten years and what it costs over two. Once this number turns negative, the yield curve has inverted which almost always signals a recession (although perhaps not for up to two years).
(The gap between the yield on the ten-year US Treasury and that on the two-year, going back three months)
Gold (measured in dollar terms) ambled along in a very tight range. This environment is tricky for gold. No one is convinced yet that inflation is going to take off. But nor does it look as though real interest rates (interest rates after inflation) are going to keep rising. That leaves gold in a bit of a limbo. I wouldn’t worry – just own some of it.
(Gold: three months)
The US dollar index – a measure of the strength of the dollar against a basket of the currencies of its major trading partners – remained solid but fell back a little towards the end of the week. This would be good news for risk assets if it continues.
(DXY: three months)
Looking at ten-year yields on the world’s major developed-market bonds – the US bounced nicely on the improving economic data. Japanese yields rebounded too (although remained negative), while German bonds managed to bounce back up into positive territory.
(Ten-year US Treasury yield: three months)
(Ten-year Japanese government bond yield: three months)
(Ten-year bund yield: three months)
Copper rallied as hopes of an improving global economy and also for a China-US trade deal grew.
(Copper: three months)
The Aussie dollar – our favourite indicator of the state of the Chinese economy – rallied along with the Chinese economy and hopes for a trade deal.
(Aussie dollar vs US dollar exchange rate: three months)
Cryptocurrency bitcoin has been the subject of some excitement this week as it pushed back above the $5,000 mark. I suspect this is a reaction to central banks starting to loosen monetary policy again.
After all, the one thing I feel comfortable saying for sure about bitcoin is that its creation and stellar rise were a product of the era of quantitative easing (QE), and its collapse came right as that period was ending and being replaced with quantitative tightening (QT). With QT now coming to an end, and more QE looking ever-so-slightly more likely, it perhaps makes sense that bitcoin is now rallying.
(Bitcoin: ten days)
The US employment outlook seemed to improve again this week. The latest monthly non-farm payrolls data showed that in March, the US added around 196,000 jobs, higher than the 177,000 expected by analysts.
Meanwhile, the four-week moving average of weekly US jobless claims fell further to 213,500, as weekly claims fell to their lowest level since December 1969, coming in at 202,000. That’s not far off the most recent four-week moving average trough of 210,500, which was set on 22 September last year.
That’s intriguing because in the past, David Rosenberg of Gluskin Sheff has noted that US stocks usually don’t peak until after this four-week moving average has hit a low for the cycle. You then get a recession about a year later. (Of course, this is a tiny sample size as there aren’t that many recessions to draw on, so take all these figures with a great big pinch of salt).
I had wondered if we’d already seen the trough last September, which would then have suggested that the S&P 500 high was in, back in October. I wasn’t sure that we wouldn’t see a new low and it’s certainly now very feasible that we might.
And if that’s the case, then maybe the market is set to claw its way back above the 2,950 or so level, which we saw in October. We’re not really very far off it now, at above 2,850.
Let’s see what happens next week.
(US jobless claims, four-week moving average: since January 2016)
The oil price (as measured by Brent crude, the international/European benchmark) rallied this week along with every other risk asset.
(Brent crude oil: three months)
Internet giant Amazon this week headed back above the $1,800 mark again. As I explained last week, I reckon that’s a good sign for the wider rally. I don’t use technical analysis a lot, but even to the untrained eye, the $1,800-$1,850 level looks like “resistance” (a point at which many investors have sold in the past).
If Amazon – which is this cycle’s stock that no institution feels worried about owning, because you won’t look stupid if it falls, because everyone else owns it too – clears that level, then I’d say the chances are high that the S&P breaks its October high.
(Amazon: 10 months)
Shares in electric-car group Tesla fell this week as first quarter production and deliveries of its crucial Model 3 cars came in below expectations. The big concern for any fans of the car group is that its rivals – all of whom are established car manufacturers – might now be taking the sector seriously enough to rank as proper competition for the first time. That would not be good news for the “disruptor”.
(Tesla: three months)
Have a great weekend.