Welcome back. We have two new podcasts for you this week – Merryn and I discuss inflationary psychology, bitcoin, exciting advances in agricultural technology, and why a student jubilee would be a good thing (although also inflationary) – listen to it now. And in the second, Merryn talks to India expert David Cornell about the sub-continent’s prospects and the opportunities for investors. Listen here.
And if you are wondering whether you should buy a copy of my book on contrarian investing, The Sceptical Investor (not that I’m biased or anything, but you really should – get it here), you can hear me talking about it with financial planner Martin Bamford on his podcast here.
Meanwhile, if you missed any Money Mornings this week, here are the links.
Tuesday: Here’s the real reason oil prices are soaring – it’s not all about Iran
Wednesday: This trend-following system is telling you to buy US stocks – and bitcoin
Thursday: The death of buy-to-let property is a useful cautionary tale for all investors
Friday: The biggest threat to investors right now is the strong US dollar
And if you don’t already subscribe to MoneyWeek, do it now – you get your first six issues free when you sign up.
It’s been a busy fortnight (I was on holiday last week, so missed our Saturday morning chart roundup). A couple of key things have happened.
The S&P 500 has made a new high – almost right after US jobless claims hit a fresh low, which is interesting given that we’ve been using that as an indicator (see further below).
That’s the good news. But what’s concerning me now, as I said in Money Morning yesterday, is the ongoing The death of buy-to-let property is a useful cautionary tale for all investors. Our indebted, loose-money-dependent global economy is not in any fit state to cope with an expensive reserve currency.
Complicating the picture is the fact that US economic growth absolutely hammered expectations for the first quarter. Growth came in at an annualised 3.2% instead of the 2.3% expected. Remember that this was a quarter that saw a much-hyped government shutdown.
On the one hand, that suggests the Fed needs to rethink its U-turn on interest rates, which is dollar-positive. On the other hand, it suggests that the economy is not as bad as everyone thinks, which might encourage investors to take profits on the dollar and invest somewhere more exciting.
We’ll have a better idea next week – for now, let’s take a look at what the charts have to say about where we are right now.
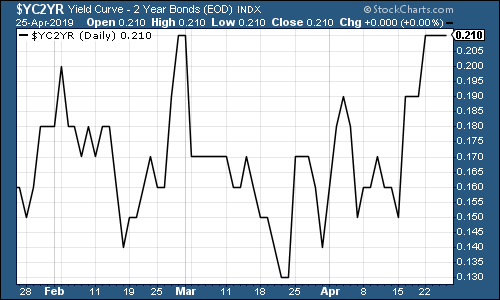
The yield curve (remind yourself of what it is here) has improved somewhat – sitting at its high for 2019 – although that’s hardly saying much.
The chart below shows the difference (the “spread”) between what it costs the US government to borrow money over ten years and what it costs over two. Once this number turns negative, the yield curve has inverted, which almost always signals a recession (although perhaps not for up to two years).
(The gap between the yield on the ten-year US Treasury and that on the two-year, going back three months)
Gold (measured in dollar terms) has had a rough couple of weeks. That’s what a combined dose of “risk-on” psychology plus a stronger dollar will do to gold.
(Gold: three months)
The US dollar index – a measure of the strength of the dollar against a basket of the currencies of its major trading partners – has been rallying strongly, partly because every other economy in the world looks wobblier than the US. If that continues, they’ll just get even wobblier still, which won’t help US companies that generate earnings overseas very much at all.
(DXY: three months)
As far as ten-year yields on the world’s major developed-market bonds go, the US is a little higher than it was a fortnight ago; Japanese bond yields are thinking about turning positive again; but Germany has slipped back into negative territory amid concerns about its slowing economy as economic data showed business sentiment collapsing.
(Ten-year US Treasury yield: three months)
(Ten-year Japanese government bond yield: three months)
(Ten-year bund yield: three months)
Copper is struggling amid fears of slowing growth, despite hopes that the US and China will kiss and make-up sometime soon.
(Copper: three months)
The Aussie dollar – our favourite indicator of the state of the Chinese economy – slid hard this week, mainly due to inflation data for the first quarter being reported as weaker than expected (weak inflation figures mean less pressure on the central bank to raise interest rates).
(Aussie dollar vs US dollar exchange rate: three months)
Cryptocurrency bitcoin also struggled this week. I suspect that’s a strong dollar issue.
(Bitcoin: ten days)
Last week, US jobless claims hit a fresh low on the four-week moving average measure, dropping to an exceptionally low 201,500. This week they jumped to 206,000, as weekly claims surged to 230,000 (apparently the timing of Easter and Passover make claims more volatile around this time of year).
The bears have, of course, pounced on the surge this week, which is fair enough. Equally though, it does mean we now have a fresh trough of 13 April. The reason we’ve been paying attention to this is because in the past, David Rosenberg of Gluskin Sheff has noted that US stocks usually don’t peak until after this four-week moving average has hit a low for the cycle. A recession tends to follow about a year later (bear in mind that this is a tiny sample size, so the average numbers are not remotely reliable).
Of course, the S&P 500 has now, just this week, hit a fresh peak. So it’s possible that we’ve now had our trough, and the recession is coming. Let’s keep an eye on the US dollar.
(US jobless claims, four-week moving average: since January 2016)
The oil price (as measured by Brent crude, the international/European benchmark) kept rallying this week, between further sanctions on Iran and news of the suspension of Russian exports to parts of Poland and Germany, due to concerns about contamination.
(Brent crude oil: three months)
Internet giant Amazon has breached the $1,850 mark that we were discussing as “resistance” in the last couple of weeks. That’s not a huge surprise really, given that the wider market has now recorded a new high. The tech giant is still a ways off its all-time high, but a little more bullishness (and a “happy” reaction to the US GDP figures rather than a panic about the strong dollar) is all it will take.
(Amazon: three months)
Shares in electric-car group Tesla were on the slide this week. Intriguingly, Tesla almost acts like a countercyclical stock sometimes, I’ve noticed – falling when everything else is going up. But this week it’s down to old-fashioned disappointment. The company missed analysts’ hopes in its first quarter results – losses were greater than expected and sales were lower. It also looks likely that it will need to raise even more money.
(Tesla: three months)