The Venezuelan government has stopped publishing official economic statistics, says Andreas Knobloch in Finanz und Wirtschaft. No wonder: the country is in a state of total collapse.
According to the International Monetary Fund, the country’s hyperinflation is getting worse, with the annual pace of price rises expected to climb from 2018’s 1,000,000% to 10,000,000%.
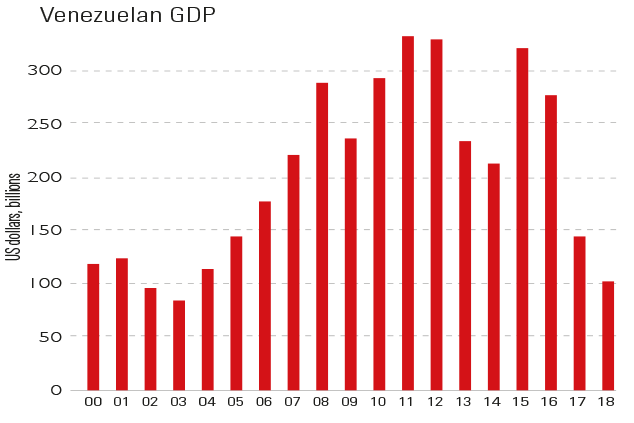
Falling oil prices have undermined export earnings; shortages, sanctions, and pervasive corruption wiped 40% and 30% off national output in 2017 and 2018 respectively; and annual GDP has receded to levels last seen in the 2000s.
The “downward spiral” is likely to endure until the political stalemate between the government and the opposition is resolved.
Viewpoint
“US political gridlock [is good news]. Stocks dislike active government because legislation shifts the rules, creating winners, losers and unintended consequences — and discourages risk-taking. Gridlock renders a do-little government. Inactivity gives executives more clarity to manoeuvre — like an obstacle course with stationary obstacles versus one comprised of big, sharp, painful, fast-moving ones. Which would you prefer? Central to this gridlock is last November’s US midterm elections. Every four-year cycle the midterms create gridlock, a little or a lot… Hence, US presidents jam all big legislation into their first two years. That legislative flurry stokes uncertainty — hurting stocks [in] presidential years one and two. Then, midterms bring gridlock for years three and four. US stocks have traditionally celebrated gridlock by rising in 91% of all third years since 1925.”
Ken Fisher, the Financial Times